 Global| May 04 2009
U.S. Pending Home Sales Rise For A Second Month
by:Tom Moeller
|in:Economy in Brief
Summary
For March, the National Association of Realtors reported that pending sales of existing homes rose another 3.2% following their little revised 2.0% gain during February. While surprising, the gains failed to recoup a sharp 7.7% [...]
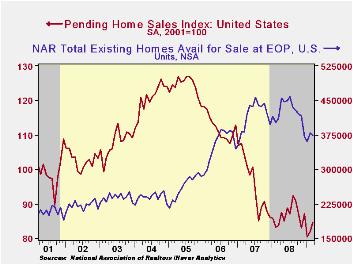
For March, the National Association of Realtors reported that pending sales of existing homes rose another 3.2% following their little revised 2.0% gain during February. While surprising, the gains failed to recoup a sharp 7.7% decline during January. Therefore, for the first quarter as a whole, sales fell 3.8% to a new series low. Consensus expectations had been for no change in March sales versus February.
Last month's gain in home sales was contained to just South (+7.7% y/y) and the West (+1.6%). Elsewhere, sales in the Northeast remained quite weak and fell month-to-month (-24.2%) while sales in the Midwest slipped 1.0%. Year-to-year, however, sales in the Midwest have rebounded 8.3%.
The home sales figures are analogous to the new home sales data from the Commerce Department in that they measure existing home sales when the sales contract is signed, not at the time the sale is closed. The series dates back to 2001.
The latest monthly gains in home sales have been accompanied
by a rise in home prices. The median sales price of an existing home
rose 4.2% in March (-12.4% y/y). The increase was the second
consecutive gain but it followed seven straight months of decline.
Prices were down by one quarter from their peak during June 2007. The
latest gains in home prices did lower housing affordability slightly
but the decline has been small. Therefore, combined with lower interest
rates, the affordability index of a home remained up by 22.7%
year-to-year and by three quarters from the 2006 low. The latest level
was a record high for the series which extends back to 1970.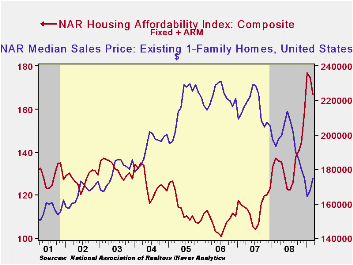
Weak home sales are encouraging potential sellers to keep their homes off the market. The Realtors Association indicated in an earlier report that the number of homes on the market and available for sale fell 9.3% during March versus one year earlier.
At the current sales rate there was a 9.8 months' supply of homes on the market and there was a 10.4 months' supply during all of last year, up from the 8.9 months supply during 2007 and 6.5 months during 2006. For single family homes, there was a 9.3 months' supply in February versus a full-year figure of 10.0 months during 2008.
The pending home sales data are available in Haver's PREALTOR database. The number of homes on the market and prices are in the REALTOR database.
| Pending Home Sales (2001=100) | March | February | Y/Y | 2008 | 2007 | 2006 |
|---|---|---|---|---|---|---|
| Total | 84.6 | 82.0 | 1.1% | 86.8 | 95.8 | 112.1 |
| Northeast | 59.5 | 63.1 | -24.1 | 72.6 | 85.6 | 98.5 |
| Midwest | 82.3 | 83.1 | 8.3 | 80.6 | 89.5 | 102.0 |
| South | 93.2 | 85.9 | 7.7 | 89.8 | 107.3 | 127.3 |
| West | 93.1 | 89.6 | 1.6 | 99.3 | 92.1 | 109.5 |
by Tom Moeller May 4, 2009
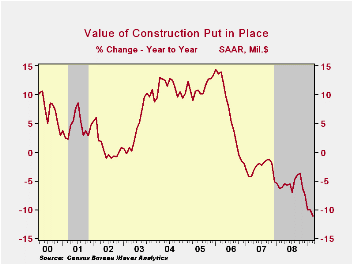
Regrettably, recent gains in the value of construction spending have been limited, small and tenuous. The value of construction put-in-place unexpectedly increased 0.3% during March following five consecutive months of decline in excess of 3% each month. Consensus expectations had been for a 1.5% drop.
A 2.0% jump in the value of nonresidential building activity accounted for much of the March surprise. The collapse of corporate profits, however, has dropped the y/y gain to just 1.7% after double-digit increases during the prior three years. The March increase reflected gains in the lodging (-5.1% y/y), commercial (-20.5 y/y), health care (+3.9% y/y), and educational (5.4% y/y) sectors.
Public construction also was strong during March and posted a
1.1% increase. The recession's effect on tax revenues, however, seems
to be taking hold. The small 2.6% year-to-year increase in the level of
activity for March left the first quarter's level just equal to the
2008 average. The value of spending on transportation facilities did
rise 1.7% in March but it was down 6.0% year-to-year while spending on
highways & streets fell 0.8% (-2.2% y/y) and was down for the
fourth straight month. The value of construction on highways &
streets is roughly one-third of the value of total public construction
spending.
The value of residential building activity continued down hard and it posted a 4.2% decline, off by one-third over the last year. Notably hard hit has been single-family construction activity which fell 8.6% in March and is off by one-half during the last twelve months. Building activity on multi-family units has held up relatively well and posted a March decline of just 1.1% (-13.7% y/y). Spending on improvements fell 1.0% (-13.1% y/y).
During the last twenty years there has been an 84% correlation between the q/q change in the value of residential building and its contribution to growth in real GDP.
The more detailed categories of construction represent the Census Bureau’s reclassification of construction activity into end-use groups. Finer detail is available for many of the categories; for instance, commercial construction is shown for automotive sales and parking facilities, drugstores, building supply stores, and both commercial warehouses and mini-storage facilities. Note that start dates vary for some seasonally adjusted line items in 2000 and 2002, and that constant-dollar data are no longer computed.
The construction put-in-place figures are available in Haver's USECON database.
| Construction (%) | March | February | Y/Y | 2008 | 2007 | 2006 |
|---|---|---|---|---|---|---|
| Total | 0.3 | -1.0 | -11.1 | -5.7 | -2.7 | 6.3 |
| Private | -0.1 | -2.1 | -16.3 | -9.8 | -6.9 | 5.5 |
| Residential | -4.2 | -5.9 | -34.0 | -27.7 | -19.8 | 1.0 |
| Nonresidential | 2.7 | 0.7 | 1.2 | 14.9 | 19.6 | 16.2 |
| Public | 1.1 | 1.3 | 2.6 | 6.7 | 12.3 | 9.3 |
by Tom Moeller May 4, 2009
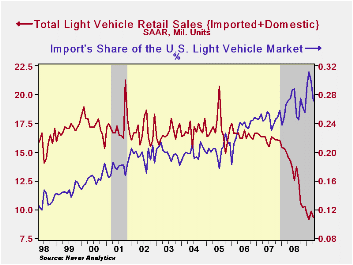
What lift may have been evident in sales of light vehicles dissolved with the report that sales in April fell, despite a new round of price discounts. U.S. unit sales of light vehicles reversed most of a March gain with a 5.5% m/m decline to 9.32M units (SAAR). The best that can be observed about sales is that the earlier decline has flattened out here in 2009 but they do remain near the lowest since 1982 according to the Autodata Corporation and Ward's Automotive News. (Seasonal adjustment of the figures is provided by the U.S. Bureau of Economic Analysis).
Imported light vehicle sales fell a hard
14.0% m/m last month to their lowest level in more than ten years. A
22.7% decline in light truck sales to 0.84M led that decline while
sales of imported autos fell a lesser 8.9%. That drop reversed nearly
all of a March increase and left sales at their lowest level of this
year. 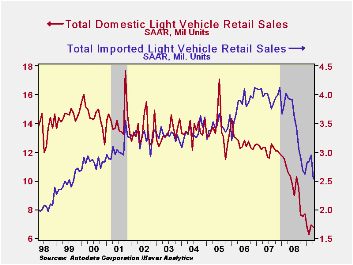
Sales of domestically-made light vehicles reversed a piece of the prior month's 10.1% increase with a m/m decline of 2.0% from March to 6.78M units. Sales of domestically made light trucks slipped 0.6% to 3.67M units after their impressive 8.7% March gain. Auto sales, however, fell larger 3.6% to 3.10M units.
Overall, import's share of the U.S. light vehicle market fell sharply to 27.2% which was their lowest level of this year. Nevertheless, the figure remained up the 2008 average of 26.3%. (Imported vehicles are those produced outside the United States.) Imports' share of the U.S. car market totaled 35.3%, up slightly from the 2008 average, while the share of the light truck market was 18.5%, roughly equal to last year.
The U.S. vehicle sales figures can be found in Haver's USECON database.
New vehicle characteristics and the cost of the corporate average fuel economy standard from the Federal Reserve Bank of Chicago can be found here.
| Light Vehicle Sales (SAAR, Mil. Units) | April | March | February | April Y/Y | 2008 | 2007 | 2006 |
|---|---|---|---|---|---|---|---|
| Total | 9.32 | 9.83 | 9.12 | -35.8% | 13.17 | 16.16 | 16.54 |
| Autos | 4.81 | 5.05 | 4.63 | -35.5 | 6.71 | 7.58 | 7.77 |
| Domestic | 3.11 | 3.23 | 2.89 | -36.0 | 4.42 | 5.07 | 5.31 |
| Imported | 1.70 | 1.83 | 1.74 | -34.7 | 2.29 | 2.52 | 2.45 |
| Light Trucks | 4.51 | 4.78 | 4.50 | -36.2 | 6.47 | 8.60 | 8.78 |
| Domestic | 3.67 | 3.70 | 3.40 | -35.8 | 5.29 | 7.10 | 7.42 |
| Imported | 0.84 | 1.08 | 1.10 | -38.9 | 1.18 | 1.47 | 1.37 |
by Louise CurleyMay 4, 2009
 Manufacturing activity
around the world appears to have
stopped contracting.Markit Economics reported today that the diffusion
indexes representing the opinions of purchasing managers in
manufacturing in a number of countries have continued to show
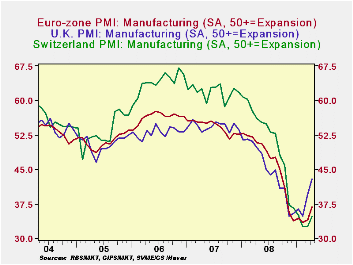
improvement in April. As the attached charts show, the PMI's in
countries in Eastern Europe and in the Far East reached their low
points at the end of last year. Those in Western Europe reached their
low points early this year.
Manufacturing activity
around the world appears to have
stopped contracting.Markit Economics reported today that the diffusion
indexes representing the opinions of purchasing managers in
manufacturing in a number of countries have continued to show
improvement in April. As the attached charts show, the PMI's in
countries in Eastern Europe and in the Far East reached their low
points at the end of last year. Those in Western Europe reached their
low points early this year.
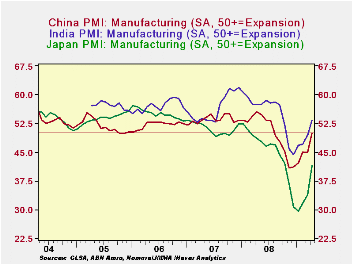
 The best showing has been in the Far East. The PMI for India
reached 53.27% in April, putting manufacturing in India in an expansion
phase. China with a PMI of 50.05% has just inched into the expansion
phase. Although Japan's PMI of 41.42% indicates that manufacturing in
Japan is still contracting, the degree of contraction is well below
that reached at the end of last year. The first chart shows the PMI's
for India, China and Japan.
The best showing has been in the Far East. The PMI for India
reached 53.27% in April, putting manufacturing in India in an expansion
phase. China with a PMI of 50.05% has just inched into the expansion
phase. Although Japan's PMI of 41.42% indicates that manufacturing in
Japan is still contracting, the degree of contraction is well below
that reached at the end of last year. The first chart shows the PMI's
for India, China and Japan.
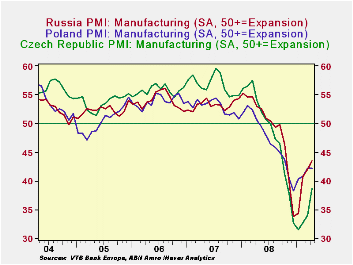
 Like Japan the PMI's in Eastern Europe suggest that degree of
contraction in manufacturing in Russia, Poland and the Czech Republic
is slowing, but they are still below the expansion phase, as shown in
the second chart.
Like Japan the PMI's in Eastern Europe suggest that degree of
contraction in manufacturing in Russia, Poland and the Czech Republic
is slowing, but they are still below the expansion phase, as shown in
the second chart.
| PURCHASING MANAGERS SURVEY OF MANUFACTURING | Apr 09 | Mar 09 |
|---|---|---|
| Diffusion Indexes 50+ = Expansion (SA) | ||
| China | 50.05 | 44.83 |
| Japan | 41.42 | 33.83 |
| India | 53.27 | 49.46 |
| Czech Republic | 38.61 | 33.95 |
| Poland | 42.14 | 41.42 |
| Russia | 43.43 | 41.97 |
| Switzerland | 34.69 | 32.62 |
| United Kingdom | 42.85 | 39.50 |
| Euro Area | 36.83 | 33.92 |
by Robert BruscaMay 4, 2009
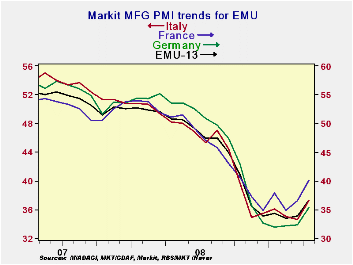
Europe’s PMI readings bounced sharply in April across EMU
nations. France made the second largest monthly rise at 3.59 points
just above the UK’s 3.35 point gain. From its cycle low, the UK has
made the greatest gain rising by 8 points with Spain and Austrian next
on gains of 6.1 and 5.9 points respectively from their cycle lows.
Italy has rebounded the least with a rise from its low reading of just
2.6 points. Looking at the levels of the indices in their respective
range of value they have occupied Italy is also the weakest followed by
Germany even though Italy’s raw MFG reading is higher than Germany’s.
These statistics show us that Europe is stirring from its lows
across countries. The UK and France are making the largest initial
moves, while Germany, the EMU’s largest economy, is one of the worst
laggards.
Just today the EU Commission has cut its outlook for growth in
EU this year, on Monday it revised lower its forecast for growth in the
European Union this year citing consumers reacting to the weakening
labor market and the slump in world trade as well as the effects of an
ongoing housing market correction. The commission, the executive arm of
the EU, presented its spring quarterly economic forecasts that
projected that gross domestic product in both the European Union and
the euro area would contract by 4 percent in 2009 and by 0.1 percent in
2010.
So amid signs that the EMU economy may have begun to
decelerate at a slower rate paving the way for an eventual upturn the
EU commission has unleashed a more pessimistic outlook.
| NTC/Markit MFG Indices | |||||||
|---|---|---|---|---|---|---|---|
| Apr-09 | Mar-09 | Feb-09 | 3-Mo | 6-Mo | 12-Mo | Percentile | |
| Euro-13 | 36.83 | 33.93 | 33.55 | 34.77 | 34.70 | 40.75 | 13.6% |
| Germany | 35.40 | 32.36 | 32.14 | 33.30 | 33.36 | 41.43 | 12.5% |
| France | 40.10 | 36.51 | 34.81 | 37.14 | 36.92 | 41.55 | 21.1% |
| Italy | 37.21 | 34.59 | 34.99 | 35.60 | 35.56 | 40.40 | 11.4% |
| Spain | 34.61 | 32.92 | 31.85 | 33.13 | 31.47 | 35.64 | 21.3% |
| Austria | 38.97 | 33.68 | 34.58 | 35.74 | 35.60 | 41.40 | 22.7% |
| Greece | 40.88 | 38.17 | 38.88 | 39.31 | 40.19 | 45.98 | 15.8% |
| Ireland | 36.10 | 35.12 | 33.20 | 34.81 | 36.39 | 39.99 | 13.1% |
| Netherlands | 38.76 | 35.92 | 35.47 | 36.72 | 37.26 | 43.12 | 13.5% |
| EU | |||||||
| UK | 42.85 | 39.50 | 34.93 | 39.09 | 37.34 | 40.69 | 37.2% |
| percentile is over range since March 2000 | |||||||

Tom Moeller
AuthorMore in Author Profile »Prior to joining Haver Analytics in 2000, Mr. Moeller worked as the Economist at Chancellor Capital Management from 1985 to 1999. There, he developed comprehensive economic forecasts and interpreted economic data for equity and fixed income portfolio managers. Also at Chancellor, Mr. Moeller worked as an equity analyst and was responsible for researching and rating companies in the economically sensitive automobile and housing industries for investment in Chancellor’s equity portfolio. Prior to joining Chancellor, Mr. Moeller was an Economist at Citibank from 1979 to 1984. He also analyzed pricing behavior in the metals industry for the Council on Wage and Price Stability in Washington, D.C. In 1999, Mr. Moeller received the award for most accurate forecast from the Forecasters' Club of New York. From 1990 to 1992 he was President of the New York Association for Business Economists. Mr. Moeller earned an M.B.A. in Finance from Fordham University, where he graduated in 1987. He holds a Bachelor of Arts in Economics from George Washington University.
More Economy in Brief


