 Global| Nov 10 2008
U.S. Pending Home Sales Retraced Most of August Rise; Trend Still Up
by:Tom Moeller
|in:Economy in Brief
Summary
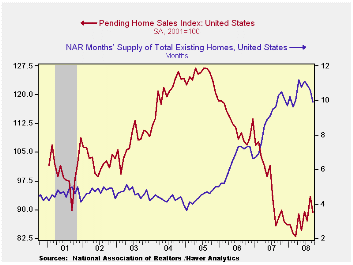
The National Association of Realtors reported that September pending sales of existing homes fell 4.6% from the prior month. Sales had risen 7.5% during August. Consensus expectations were for a slightly more moderate m/m drop. [...]
The National Association of Realtors reported that September pending sales of existing homes fell 4.6% from the prior month. Sales had risen 7.5% during August. Consensus expectations were for a slightly more moderate m/m drop.
Despite the latest decline, the level of sales on a three-month basis was up 6.6% from its March low.
The home sales figures are analogous to the new home sales data from the Commerce Department in that they measure existing home sales when the sales contract is signed, not at the time the sale is closed. The series dates back to 2001.
The Mortgage Meltdown, Financial Markets, and the Economy is adapted from a speech by San Francisco Federal Reserve Bank President Janet Yellen and it can be found here.
Across the country's regions the pattern of recent sales
movements has been very erratic. Sales in the West led the September
increase with a 3.7% m/m rise on the heels of an 18.4% spurt upward in
August. The latest was the highest level of sales since early 2006. But
that was all of the good news in the latest home sales report. Sales in
the Northeast slumped 16.8% m/m to a new low for the series. Sales in
the South fell 7.9% and the decline reversed most of the modest firming
of sales during the prior three months. Home sales in the Midwest
ticked down 0.7% though sales still were a moderate 12.4% higher than
the March low.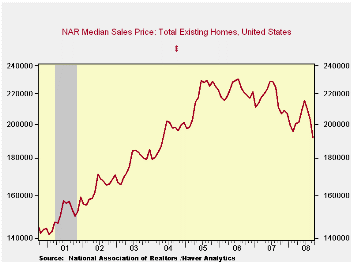
Weak home sales are encouraging potential sellers to keep their homes off the market. The Realtors Association indicated in an earlier report that the number of homes on the market and available for sale fell a not seasonally adjusted 1.6% (-2.4% y/y) after a 5.2% August decline. That was the second y/y decline since early 2005.
At the current sales rate there was a 9.9 months' supply of homes on the market, the lowest since February but still higher than 8.9 months last year and 6.5 months during 2006. For single family homes the months' supply fell to 9.4, the lowest since March but still well above the 8.7 average of last year.
The median sales price of an existing single family home fell 5.7% (-9.0% y/y) during September. Prices were down 16.3% from their peak during June of last year. For single family homes, prices fell 5.6% (-8.6% y/y) and they were off 16.8% from last year's June peak.
The pending home sales data are available in Haver's PREALTOR database and the number of homes on the market and prices are in the REALTOR database.
The Federal Reserve Board and the U.S. Treasury announced the restructuring of the government's financial support to the American International Group (AIG) and the text of the announcement can be found here
What Is Liquidity Risk? also is from the Federal Reserve Bank of San Francisco and it is available here.
| Pending Home Sales (2001=100) | September | August | Y/Y | 2007 | 2006 | 2005 |
|---|---|---|---|---|---|---|
| Total | 89.2 | 93.5 | 1.6% | 95.7 | 112.1 | 124.3 |
| Northeast | 66.4 | 79.8 | -9.4 | 85.6 | 98.5 | 108.3 |
| Midwest | 83.3 | 83.9 | -3.1 | 89.6 | 102.0 | 116.4 |
| South | 89.0 | 96.6 | -11.3 | 107.3 | 127.3 | 134.8 |
| West | 113.6 | 109.5 | 39.6 | 92.1 | 109.5 | 128.6 |
by Robert Brusca November 10, 2008
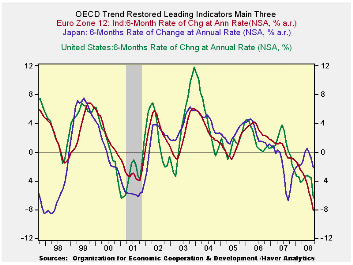
The OECD trend-adjusted cyclical leading indicators showed a clear pattern of growth deteriorating in the OECD region. The downturn is of increasing severity. Even Japan after a brief flirtation with improving is getting weaker again. Over 3, 6 and 12 months it is Europe that is now declining the most rapidly.
The OECD prefers to look at these indicators over six months. On that basis the weakness is just as present. As we prepare for the G-20 meeting the OECD area is shrinking rapidly.
Over six months the pace of decline for the OECD is at a rate of 6.5%. Six months ago the six month pace for that index was -2%. One year ago the pace was just -0.8%. And 18n months ago that pace was an increase of 2.5%. All that amounts to a pretty fast drop off. That is the sort of thing that is typical, not of a slowdown, but of a recession.
| OECD Trend-Restored Leading Indicators | ||||
|---|---|---|---|---|
| Growth Progression-SAAR | ||||
| 3Mos | 6Mos | 12mos | Yr-Ago | |
| OECD | -9.8% | -6.5% | -4.3% | 0.8% |
| OECD 7 | -11.1% | -6.7% | -5.0% | 0.0% |
| OECD Europe | -12.1% | -9.2% | -5.8% | 0.2% |
| OECD Japan | -6.8% | -2.3% | 0.0% | -4.0% |
| OECD US | -10.6% | -5.6% | -5.3% | 1.3% |
| Six month readings at 6-Mo Intervals | ||||
| Recent six | 6Mo Ago | 12Mo Ago | 18MO Ago | |
| OECD | -6.5% | -2.0% | -0.8% | 2.5% |
| OECD 7 | -6.7% | -3.2% | -1.2% | 1.3% |
| OECD Europe | -9.2% | -2.3% | -1.0% | 1.3% |
| OECD Japan | -2.3% | 2.2% | -7.8% | -0.1% |
| OECD US | -5.6% | -5.0% | 0.8% | 1.9% |
| Slowdowns indicated by BOLD RED. | ||||
by Robert Brusca November 10, 2008
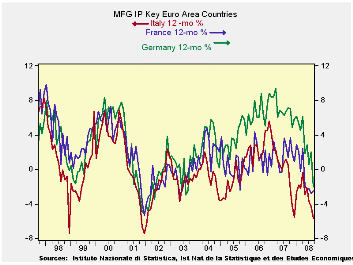
EMU IP is sinking fast. Add Italy and France to the list of large EMU countries with industrial output dropping like a stone. The Q3 growth rates for IP in France and in Italy each are negative, Italy’s drop is at a huge -8.4% pace while France’s drop is a still weak at -2.7%. In Italy consumer goods, capital goods and intermediate goods output each is falling. Transportation is twice as weak in Italy as it is in France for the quarter. In France intermediate goods output is even a bit weaker than it is in Italy in Q3 but the drop in output of capital goods is quite a bit less severe and consumer goods output in France continued to rise strongly in Q3. French consumer goods output, in fact, has risen in each month of the third quarter as well.
On balance, as the accompanying chart shows, IP is falling rapidly in Germany, Italy and France. The drop in France shows some signs of leveling off in its pace of decline over the past few months while Italy and Germany are still plunging at what seem to be accelerating rates of decline. Italy ’s pattern of decline is a bit more complicated than that for Germany and France. But Germany has the most severe weakness. While it has so far the smallest Yr/Yr drop, its output has decelerated more sharply since German output was growing so much more strongly until early 2008 when the pace of increase suddenly and sharply moved lower and into a state of decline.
| French IP Excluding Construction | |||||||
|---|---|---|---|---|---|---|---|
| Saar except m/m | Sep-08 | Aug-08 | Jul-08 | 3-mo | 6-mo | 12-mo | Quarter-to-date |
| IP total | -0.5% | -0.4% | 1.3% | 1.6% | -4.2% | -1.9% | -2.7% |
| Consumer | 0.4% | 0.1% | 1.5% | 8.2% | 2.8% | -0.4% | 6.2% |
| Capital | 0.7% | 0.0% | 0.3% | 4.2% | 0.5% | 1.7% | -3.8% |
| Intermediate | -1.5% | -0.8% | 1.3% | -4.1% | -7.2% | -4.4% | -5.0% |
| Memo | |||||||
| Auto | -3.1% | -1.2% | 4.2% | -1.3% | -14.8% | -8.3% | -9.3% |
| Italy IP Excluding Construction | |||||||
| Saar except m/m | Sep-08 | Aug-08 | Jul-08 | 3-mo | 6-mo | 12-mo | Quarter-to-date |
| IP-MFG | -2.3% | 0.4% | -1.3% | -12.1% | -8.0% | -5.7% | -8.4% |
| Consumer | -3.3% | 0.8% | -2.3% | -18.0% | -6.5% | -5.4% | -10.4% |
| Capital | -2.5% | -0.9% | -0.5% | -14.9% | -11.1% | -8.2% | -13.7% |
| Intermediate | -2.6% | 1.1% | -0.3% | -7.2% | -5.9% | -5.4% | -3.5% |
| Memo | |||||||
| Transportation | -5.7% | 1.9% | -3.9% | -27.2% | -21.1% | -13.1% | -22.4% |
by Louise Curley November 10, 2008
Inflation is beginning to take a back seat in the deliberations of Central Bankers. The financial crisis, rising unemployment and declining production are overshadowing inflation fears at the same time that these fears are lessening. No matter the actual level of inflation, incoming data are showing that inflation rates are declining worldwide.
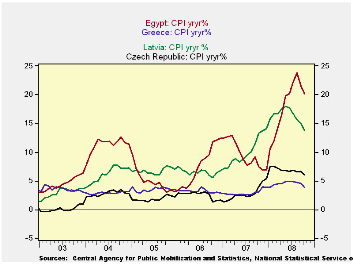
Today Egypt, Greece, Latvia and the Czech Republic reported
their Consumer Price Indexes for October. The inflation rate as
measured by the year-to-year increase in the CPI has recently been
declining at varying degrees of speed in each country. Egypt, with
inflation over 20%, has seen its inflation rate decline in the last two
months from 23.8% in August to 20.1% in October. Another high inflation
rate country, Latvia, has experienced declines in its inflation rate in
the last five months, from 17.7% in June to 13.8% in October. Greece
and the Czech Republic with relatively low inflation rates have
nevertheless also witnessed declines in their inflation rates.
Inflation in Greece has come down to 3.9% in October from 4.8% in June,
and to 6.0% from 6.7%, respectively, in the Czech republic. The "core"
inflation rate in the Czech Republic has declined to 1.65 % in October
from 2.64 % in June. Inflation rates for the four countries are shown
in the first chart.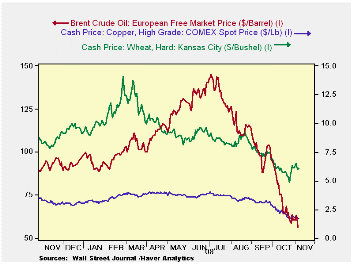
Dramatic declines in commodity prices over the past year are responsible for much of the improved inflation outlook worldwide. The second chart shows the prices of wheat, copper and oil over the past year.
| INFLATION RATES | Oct 08 | Sep 08 | Aug 08 | Jul 08 | Jun 08 |
|---|---|---|---|---|---|
| Czech Republic: Total | 6.0 | 6.6 | 6.5 | 6.9 | 6.7 |
| Czech Republic: Core | 1.65 | 2.54 | 2.54 | 2.64 | 2.64 |
| Greece: Total | 3.90 | 4.58 | 4.68 | 4.83 | 4.89 |
| Egypt: Total | 20.13 | 21.52 | 23.79 | 22.15 | 20.22 |
| Latvia: Total | 13.73 | 14.88 | 15.72 | 16.61 | 17.74 |

Tom Moeller
AuthorMore in Author Profile »Prior to joining Haver Analytics in 2000, Mr. Moeller worked as the Economist at Chancellor Capital Management from 1985 to 1999. There, he developed comprehensive economic forecasts and interpreted economic data for equity and fixed income portfolio managers. Also at Chancellor, Mr. Moeller worked as an equity analyst and was responsible for researching and rating companies in the economically sensitive automobile and housing industries for investment in Chancellor’s equity portfolio. Prior to joining Chancellor, Mr. Moeller was an Economist at Citibank from 1979 to 1984. He also analyzed pricing behavior in the metals industry for the Council on Wage and Price Stability in Washington, D.C. In 1999, Mr. Moeller received the award for most accurate forecast from the Forecasters' Club of New York. From 1990 to 1992 he was President of the New York Association for Business Economists. Mr. Moeller earned an M.B.A. in Finance from Fordham University, where he graduated in 1987. He holds a Bachelor of Arts in Economics from George Washington University.
More Economy in Brief


