 Global| Dec 10 2008
U.S. Pending Home Sales Fell
by:Tom Moeller
|in:Economy in Brief
Summary
The National Association of Realtors indicated that October pending sales of existing homes fell 0.7% m/m after September's 4.3% decline. Consensus expectations were for a greater 3.0% drop. Despite the two latest declines the level [...]
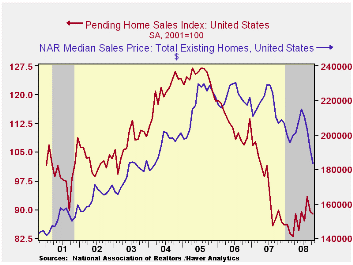
The National Association of Realtors indicated that October pending sales of existing homes fell 0.7% m/m after September's 4.3% decline. Consensus expectations were for a greater 3.0% drop. Despite the two latest declines the level of sales on a three-month basis continued to rise, up 7.5% from the March low.
The home sales figures are analogous to the new home sales data from the Commerce Department in that they measure existing home sales when the sales contract is signed, not at the time the sale is closed. The series dates back to 2001.
Lower prices continued to bolster home sales. The median sales
price of an existing home fell for the fourth straight month during
October (-11.3% y/y). Prices were down 20.0% from their peak during
June of last year. For single-family homes, prices fell 4.5% during
October and prices were off 20.7% from their peak.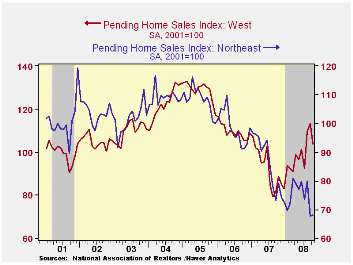
Weakness in the West led the October sales' decline, but not by enough to stall the upward trend. On a three-month basis sales in the West rose to the highest level since the summer of 2006. Sales in the Midwest also were weak during October. The 4.3% decline followed a 0.7% downtick during September. October sales in the South were the strongest of the regions and they rose 7.8%. That pulled the 3-month average to its highest level since March. Home sales in the Northeast ticked up 0.6% but that followed a 15.2% m/m decline during September. The 3-month level of sales was near the lowest for this cycle,
Weak home sales are encouraging potential sellers to keep their homes off the market. The Realtors Association indicated in an earlier report that the number of homes on the market and available for sale fell for the third consecutive month (-4.5% y/y).
At the current sales rate there was a 10.2 months' supply of homes on the market, higher than 8.9 months last year and 6.5 months during 2006. For single family homes the months' supply ticked up to 9.6, near the lowest since March but still well above the 8.7 average of last year.
The pending home sales data are available in Haver's PREALTOR database and the number of homes on the market and prices are in the REALTOR database.
U.S. Economic Growth Will Be Weak in 2009, Chicago Fed Economic Outlook Symposium. Click here for the summary.
| Pending Home Sales (2001=100) | October | September | Y/Y | 2007 | 2006 | 2005 |
|---|---|---|---|---|---|---|
| Total | 88.9 | 89.5 | -1.0% | 95.7 | 112.1 | 124.3 |
| Northeast | 68.1 | 67.7 | -14.1 | 85.6 | 98.5 | 108.3 |
| Midwest | 79.7 | 83.3 | -6.8 | 89.6 | 102.0 | 116.4 |
| South | 95.9 | 89.0 | -2.9 | 107.3 | 127.3 | 134.8 |
| West | 103.7 | 113.6 | 17.3 | 92.1 | 109.5 | 128.6 |
by Tom Moeller December 10, 2008
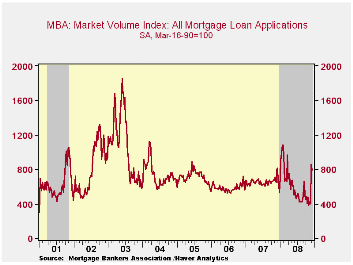
According to the Mortgage Bankers Association, the total number of mortgage applications fell a slight 7.1% last week. They had doubled during the prior week to take advantage of lower interest rates and the Fed's announcement that it would buy the debt of government sponsored enterprises (GSEs) and mortgage-backed securities (MBSs).
The Future of Mortgage Finance in the United States is Fed Chairman Bernanke's 10/31/08 speech and it can be found here.
The index of applications to refinance a home mortgage slipped 0.9% last week after having tripled due to the government's guarantee.
Applications for a mortgage to purchase a home retraced most
of the prior week's gain with a 17.4% w/w decline.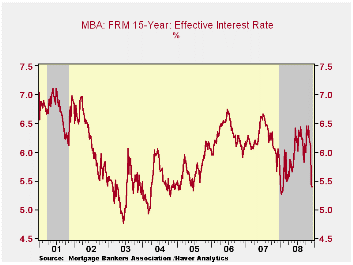
The effective interest rate on a conventional 15-year mortgage dipped after having plummeted during the week prior. The decline to 5.40% left them down nearly a full percentage point from the October average. For a 30-year mortgage rates also fell slightly to 5.69%. Interest rates on 15 and 30 year mortgages are closely correlated (>90%) with the rate on 10-year Treasury securities. For an adjustable rate 1-Year mortgage the rate rose to 6.83% after having averaged 6.90% during November.
During the last ten years there has been a (negative) 79% correlation between the level of applications for purchase and the effective interest rate on a 30-year mortgage. Moreover, during the last ten years there has been a 61% correlation between the y/y change in purchase applications and the change in new plus existing single family home sales.
The Mortgage Bankers Association surveys between 20 to 35 of the top lenders in the U.S. housing industry to derive its refinance, purchase and market indexes. The weekly survey covers roughly 50% of all U.S. residential mortgage applications processed each week by mortgage banks, commercial banks and thrifts. Visit the Mortgage Bankers Association site here.
The figures for weekly mortgage applications are available in Haver's SURVEYW database.
| MBA Mortgage Applications (3/16/90=100) | 12/05/08 | 11/28/08 | Y/Y | 2007 | 2006 | 2005 |
|---|---|---|---|---|---|---|
| Total Market Index | 796.8 | 857.7 | -1.8% | 652.6 | 584.2 | 708.6 |
| Purchase | 298.1 | 361.1 | -36.8% | 424.9 | 406.9 | 470.9 |
| Refinancing | 3,767.3 | 3,802.8 | 30.8% | 1,997.9 | 1,634.0 | 2,092.3 |
by Robert Brusca December 10, 2008
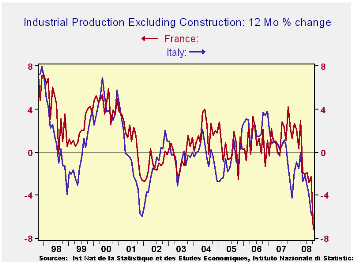
Output plunges in Italy and in France.
In France a large part of the drop in IP is the weakened auto
sector. Output in the auto sector fell by 14.3%. Declines, as the table
shows, are widespread. The drops in output in France and in Italy are
worse than those in 2000 -2001. Output drops in France are gathering
momentum across sectors with the exception of capital goods. Italy
shows much the same situation with sequential growth rates indicating a
quickening pace of decline across sectors –the consumer sector being an
unpersuasive exception. In the quarter to date both countries show
sharp declines in output are underway in the -17% to -18% range
(annualized). Europe is in the throes of the severe output decline
phase of the recession. There are riots in Greece that mix some civil
unrest in with protests about how the economy is being managed.
| French IP excluding Construction | |||||||
|---|---|---|---|---|---|---|---|
| Saar except m/m | Oct-08 | Sep-08 | Aug-08 | 3-mo | 6-mo | 12-mo | Quarter-to-date |
| IP total | -2.7% | -0.8% | -0.5% | -14.7% | -12.3% | -7.2% | -18.3% |
| Consumer Goods | -0.4% | -0.2% | -0.6% | -4.6% | -1.8% | -3.3% | -4.3% |
| Capital Goods | -0.5% | 0.8% | 0.0% | 1.0% | -4.9% | 0.0% | 0.0% |
| Intermediate Goods | -3.5% | -1.7% | -0.9% | -22.0% | -16.3% | -10.1% | -26.0% |
| Memo | |||||||
| Auto | -14.3% | -5.9% | -0.2% | -58.2% | -44.4% | -29.2% | -69.3% |
| Italy IP excluding Construction | |||||||
| Saar except m/m | Oct-08 | Sep-08 | Aug-08 | 3-mo | 6-mo | 12-mo | Quarter-to-date |
| IP-MFG | -1.1% | -2.9% | 0.1% | -14.6% | -12.9% | -6.8% | -16.7% |
| Consumer Goods | 0.8% | -3.3% | 0.6% | -7.6% | -11.1% | -4.6% | -7.4% |
| Capital Goods | -1.5% | -2.7% | -1.1% | -19.1% | -18.2% | -8.7% | -19.9% |
| Intermediate Goods | -2.1% | -3.5% | 0.9% | -17.5% | -13.4% | -8.3% | -22.3% |
| Memo | |||||||
| Transportation | -5.8% | -5.6% | 1.7% | -33.4% | -30.5% | -19.8% | -42.9% |

Tom Moeller
AuthorMore in Author Profile »Prior to joining Haver Analytics in 2000, Mr. Moeller worked as the Economist at Chancellor Capital Management from 1985 to 1999. There, he developed comprehensive economic forecasts and interpreted economic data for equity and fixed income portfolio managers. Also at Chancellor, Mr. Moeller worked as an equity analyst and was responsible for researching and rating companies in the economically sensitive automobile and housing industries for investment in Chancellor’s equity portfolio. Prior to joining Chancellor, Mr. Moeller was an Economist at Citibank from 1979 to 1984. He also analyzed pricing behavior in the metals industry for the Council on Wage and Price Stability in Washington, D.C. In 1999, Mr. Moeller received the award for most accurate forecast from the Forecasters' Club of New York. From 1990 to 1992 he was President of the New York Association for Business Economists. Mr. Moeller earned an M.B.A. in Finance from Fordham University, where he graduated in 1987. He holds a Bachelor of Arts in Economics from George Washington University.
More Economy in Brief


