 Global| Jan 04 2008
U.S. Payrolls Weak, Unemployment Rate Surged
by:Tom Moeller
|in:Economy in Brief
Summary
For December, the Bureau of Labor Statistics reported that nonfarm payrolls rose a meager 18,000 versus expectations for a 50,000 increase. That expectation was ratcheted down after yesterday's ADP report of a modest 40,000 increase [...]
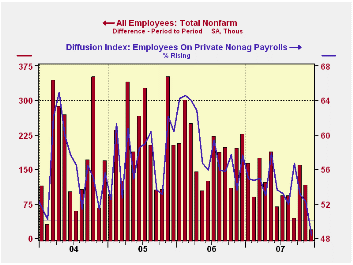
For December, the Bureau of Labor Statistics reported that nonfarm payrolls rose a meager 18,000 versus expectations for a 50,000 increase. That expectation was ratcheted down after yesterday's ADP report of a modest 40,000 increase in private nonfarm payrolls.
The December increase was the weakest since 2003. It was accompanied by a slight upward revision to the gain in November jobs but a downward revision to October.
Private industries payrolls fell 13,000 (+0.9% y/y), the first monthly decline since 2003.
Perhaps portending further weakness in payroll jobs was a drop
in the one month diffusion index of job gain. At 48.4% this measure of
the breadth of job growth amongst industries was at its lowest and
below 50 for the first time since 2003.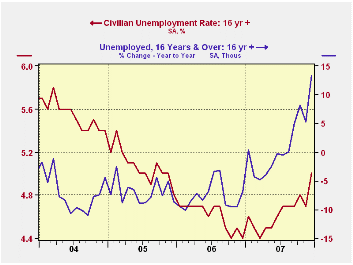
The unemployment rate surged to 5.0% last month from 4.7% in November. Household employment fell 436,000 (0.2% y/y and reversed most of November's 631,000 surge. The ranks of the unemployed grew 474,000 (13.2% y/y) and the labor force rose just 38,000 (0.8% y/y) after a 522,000 November jump. The labor force participation rate held steady at 66.0%, down from the 66.2% averaged last year.
The level of average hours worked has remained notably stable recently. As a result, the 4Q level of aggregate hours worked (employment times hours) rose just 1.0% (AR) following a 3Q rise of 1.2% and a 2.1% increase during 2Q. During the last ten years there has been a 44% correlation between the gain in hours and the gain in real GDP. That correlation is down from 56% over the last 20 years and from 74% over the last 30 due to the faster growth in worker productivity.
Factory sector payrolls fell another 31,000, the largest
decline since August. Construction employment fell out of bed and
posted a 49,000 drop last month which was the largest since February.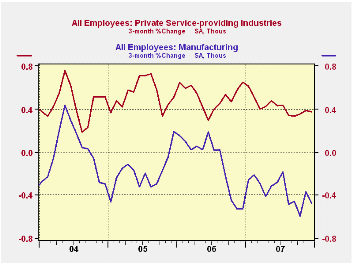
Continuing the shortfall in last month's job gain was the modest 62,000 rise in private service sector employment (1.5% y/y). That was half the November gain and the weakest since 2005. Retail employment fell 24,000 (+0.3% y/y) while jobs in finance fell 4,000 (-0.2% y/y), the sixth decline in the last seven months. Jobs in clothing stores fell 7,900 (+0.4% y/y) and temporary help services jobs were unchanged (-1.7% y/y).
Firm were job gains in the health care sector which rose 36,900 (3.2% y/y). Professional & business services rose 43,000 (1.8% y/y).
Employment in the government sector also rose a moderate 31,000 (1.2% y/y) after a 28,000 worker increase in November. Jobs with the Federal government fell 4,000 (-0.2% y/y).
Average hourly earnings increased 0.4% and the prior month's gain was revised up slightly. Factory sector earnings reversed all of the prior month's gain with a 0.5% decline (+2.6% y/y). Private service-providing earnings rose 0.5% (4.1% y/y).
| Employment: 000s | December | November | October | Y/Y | 2007 | 2006 | 2005 |
|---|---|---|---|---|---|---|---|
| Payroll Employment | 18 | 115 | 159 | 1.0% | 1.3% | 1.9% | 1.7% |
| Previous | -- | 94 | 170 | -- | -- | -- | -- |
| Manufacturing | -31 | -13 | -23 | -1.5% | -1.2% | -0.2% | -0.6% |
| Construction | -49 | -37 | -20 | -2.5% | -0.8% | 4.8% | 5.2% |
| Average Weekly Hours | 33.8 | 33.8 | 33.8 | 33.9 (Dec '06) | 33.8 | 33.8 | 33.8 |
| Average Hourly Earnings | 0.4% | 0.4% | 0.2% | 3.7% | 3.9% | 3.9% | 2.8% |
| Unemployment Rate | 5.0% | 4.7% | 4.8% | 4.4% (Dec '06) | 4.6% | 4.6% | 5.1% |
by Tom Moeller January 4, 2008
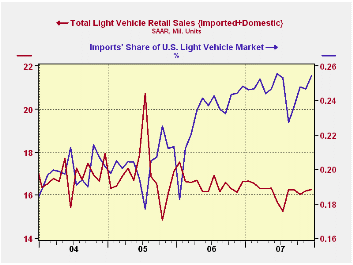
U.S. sales of light vehicles rose all of 0.4% last month to a 16.27M unit annual selling rate, according to the Autodata Corporation. The uptick followed a 0.9% increase during November. These recent upticks left sales for the year down 2.2% from 2006 when sales fell 2.5% from 2005.
Sales of domestically made light vehicles fell
0.6% last month after a 1.0% November rise. For the full year
domestically made vehicle sales fell 4.2%, a decline similar to the
5.9% drop in 2006. Sales of U.S. made cars fell 4.8% last month and
were down 4.5% for the year. Sales of domestically made light trucks,
however, rose 2.9% in December and made up a small part of the prior
three months' decline. For the year sales of domestically made light
trucks fell 4.0% on top of an 8.7% 2006 decline.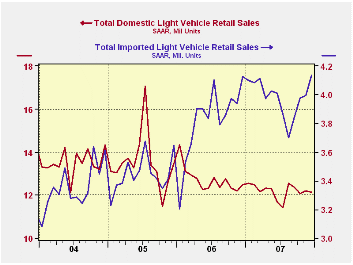
Sales of imported light vehicles rose 3.6% last month for the fourth consecutive monthly increase. The rise to 4.14M units was to the new record level. Last month's increase was due to a 4.7% gain in sales of imported autos. A 1.7% rise in sales of imported light trucks lifted sales 8.2% for the full year.
Import's share of the U.S. light vehicle market rose to a near record 25.4% during December. The rise in import's share for all of 2007 to 24.6% was a new record for any year.
Today's speech by Fed Vice ChairmanDonald L. Kohn At the American Economic Association Session can be found here.
Stock Prices and Business Investment from the Federal eserve Bank of Philadelphia is available here.
| Light Vehicle Sales (SAAR, Mil. Units) | December | November | Y/Y | 2007 | 2006 | 2005 |
|---|---|---|---|---|---|---|
| Total | 16.27 | 16.20 | 0.4% | 16.18 | 16.55 | 16.96 |
| Autos | 7.82 | 7.97 | -1.8% | 7.58 | 7.77 | 7.65 |
| Domestic | 5.21 | 5.47 | -2.4% | 5.07 | 5.31 | 5.40 |
| Imported | 2.62 | 2.50 | -0.6% | 2.51 | 2.45 | 2.25 |
| Light Trucks | 8.44 | 8.22 | -2.4% | 8.60 | 8.78 | 9.32 |
| Domestic | 6.92 | 6.73 | -3.2% | 7.12 | 7.42 | 8.12 |
| Imported | 1.52 | 1.49 | 1.8% | 1.48 | 1.37 | 1.20 |
by Tom Moeller January 4, 2008
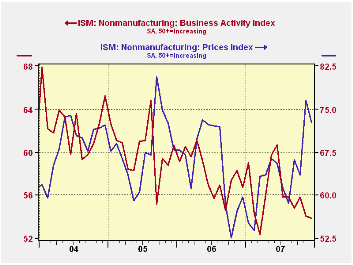
According to the Institute for Supply Management, the December Business Activity Index for the non-manufacturing sector fell to 53.9 from 54.1. A figure above 50 indicates rising activity and the m/m decline somewhat outpaced Consensus expectations for a lesser fall.
Since the series' inception in 1997 there has been a 44% correlation between the level of the Business Activity Index in the non-manufacturing sector and the Q/Q change in real GDP for the services and the construction sectors. The correlation of the factory sector ISM index with the change in real GDP less just services is a higher 57%, though over the last ten years it only has been 34%.
Both the new orders sub index and the employment sub index rose, though the latter remained ear the 2007 average which was down from 2006 which was down from 2005. Since the series' inception in 1997 there has been a 56% correlation between the level of the ISM non-manufacturing employment index and the m/m change in payroll employment in the service producing plus the construction industries.
Pricing power eased m/m, but only slightly. Since inception ten years ago, there has been a 60% correlation between the price index and the q/q change in the GDP services chain price index.
ISM surveys more than 370 purchasing managers in more than 62 industries including construction, law firms, hospitals, government and retailers. The non-manufacturing survey dates back to July 1997.
The Business Activity Index for the non-manufacturing sector reflects a question separate from the subgroups mentioned above. In contrast, the ISM manufacturing sector composite index is a weighted average of five components.
Sticky Prices: Why Firms Hesitate to Adjust the Price of Their Goods from the Federal Reserve Bank of New York an be found here.
| ISM Nonmanufacturing Survey | December | November | December '06 | 2007 | 2006 | 2005 |
|---|---|---|---|---|---|---|
| Business Activity Index | 53.9 | 54.1 | 56.7 | 56.0 | 58.0 | 60.2 |
| Prices Index | 72.7 | 76.5 | 59.7 | 63.9 | 65.2 | 68.0 |
by Robert Brusca January 4, 2008
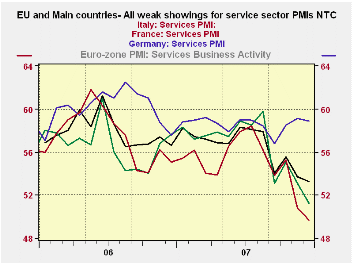
The chart tells a clear story of malaise and decline in
Europe’s service sector. Survey readings for services industries in the
overall community are weak. Individual countries are weak across the
board with the exception of France which bucked the trend last month by
rising when other countries’ indices fell hard. This month France’s
service sector index has edged lower but it is vastly stronger than in
most other major EMU nations. The UK, an EU member, is also showing
pronounced sector weakness.
If we position the current readings in their respective ranges
of values since May of 2000 we find all are below their range midpoints
except France which stands in its 60th percentile. Germany and the
overall EMU measure are in their respective 44th to 45th percentiles.
Spain, Ireland and Italy are roughly in the bottom third of their
respective ranges with Italy even weaker than that.
The service sector is an important engine of job growth in
Europe as it is in the US. And concerns over the euro’s strength and
the fallout from the financial sector problems in the US are problems
that are in play. The MFG sector in Europe has actually bounced from
its lows over the past two months in the face of such pressures.
Services however, continue to weaken. The ECB is on the spot with
another strong inflation reading in December that defies it to take
anti-inflation steps as oil prices spurt and while the euro is
screaming to stronger values. The actual weakness in the economy may
seem to make the ECB’s job that much harder, but in fact actual
weakness makes ECB temperance less of an act of bravado. Its failure to
hike rates in the face of inflation and spare the euro further stress
is easier if the economy is showing some real weakness up front. The
service sector is giving the ECB a real excuse for playing the waiting
game- right or wrong.
| NTC Services Indices for EU/EMU | |||||||
|---|---|---|---|---|---|---|---|
| Dec-07 | Nov-07 | Oct-07 | 3-Mo | 6-Mo | 12-Mo | Percentile | |
| Euro-13 | 53.14 | 54.14 | 55.81 | 54.36 | 55.62 | 56.58 | 43.5% |
| Germany | 51.24 | 53.09 | 55.08 | 53.14 | 55.12 | 56.49 | 44.9% |
| France | 58.89 | 59.15 | 58.48 | 58.84 | 58.44 | 58.60 | 60.4% |
| Italy | 49.71 | 50.77 | 55.27 | 51.92 | 54.04 | 54.86 | 15.7% |
| Spain | 50.99 | 50.69 | 52.45 | 51.38 | 52.72 | 54.45 | 31.1% |
| Ireland | 53.53 | 52.81 | 56.48 | 54.27 | 55.13 | 57.18 | 36.7% |
| EU only | |||||||
| UK | 52.36 | 51.95 | 53.08 | 52.46 | 54.78 | 56.25 | 42.5% |
| percentile is over range since May 2000 | |||||||
by Robert Brusca January 4, 2008
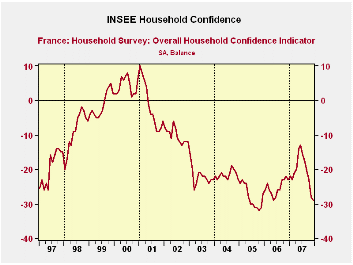
While France’s services sector is holding up pretty well the
consumer is not keeping up that sort of pace. Consumer confidence fell
by one point in December but the index has lost 16 points from its peak
in this cycle and the resulting index now stands at a relatively weak
position with respect to its recent range of values. Confidence is now
in the bottom ten percent of its range over the past eighteen years.
Consumers say it’s the worst price environment in the past 18 years.
They expect pricing conditions to ease up in the 12-months ahead.
Households assess their living conditions over the past 12
months as in the bottom seven percentile of the past 18 year’s results.
They see that improving to the bottom 19 percentile in the year ahead.
Households place unemployment prospects in the bottom 38th
percentile for the 12 months ahead. Their spending plans are in the
bottom third of their range, a similar reading Households assess their
current financial situation as middling: in the 52nd percentile of its
range. But over the past 12months they place it in the bottom fifth of
its range and over the next 12 months they expect a bottom quarter of
the range result. Consumer responses are certainly more downbeat than
the performance of the French services sector would let us infer.
France is clearly one to watch to see which way its various and
disparate readings eventually coalesce or if they do.
| INSEE Household Monthly Survey | ||||||||||
|---|---|---|---|---|---|---|---|---|---|---|
| Since Jan 1990 | Since Jan 1990 | |||||||||
| Dec 07 |
Nov 07 |
Oct 07 |
Sep 07 |
%tile | Rank | Max | Min | Range | Mean | |
| Household Confidence | -29 | -28 | -23 | -21 | 9.3 | 196 | 10 | -33 | 43 | -17 |
| Living Standards | ||||||||||
| past 12 Mos | -61 | -59 | -54 | -51 | 7.1 | 207 | 18 | -67 | 85 | -37 |
| Next 12-Mos | -31 | -36 | -25 | -26 | 19.3 | 165 | 15 | -42 | 57 | -18 |
| Unemployment: Next 12 | 5 | 11 | 11 | 10 | 38.2 | 172 | 73 | -37 | 110 | 30 |
| Price Developments | ||||||||||
| Past 12Mo | 39 | 30 | 17 | 12 | 100.0 | 1 | 39 | -57 | 96 | -19 |
| Next 12-Mos | -23 | -8 | -19 | -16 | 40.7 | 33 | 31 | -60 | 91 | -34 |
| Savings | ||||||||||
| Favorable to save | 30 | 27 | 31 | 36 | 72.2 | 32 | 40 | 4 | 36 | 23 |
| Ability to save Next 12 | -12 | -13 | -7 | -6 | 37.9 | 147 | 6 | -23 | 29 | -8 |
| Spending | ||||||||||
| Favorable for major purchase | -23 | -18 | -11 | -10 | 32.8 | 173 | 16 | -42 | 58 | -12 |
| Financial Situation | ||||||||||
| Current | 14 | 15 | 16 | 16 | 52.4 | 66 | 24 | 3 | 21 | 12 |
| Past 12 Mos | -23 | -19 | -17 | -15 | 18.2 | 190 | -5 | -27 | 22 | -16 |
| Next 12-Mos | -9 | -8 | -6 | -5 | 25.9 | 206 | 11 | -16 | 27 | 0 |
| Number of observations in the period | 215 | |||||||||

Tom Moeller
AuthorMore in Author Profile »Prior to joining Haver Analytics in 2000, Mr. Moeller worked as the Economist at Chancellor Capital Management from 1985 to 1999. There, he developed comprehensive economic forecasts and interpreted economic data for equity and fixed income portfolio managers. Also at Chancellor, Mr. Moeller worked as an equity analyst and was responsible for researching and rating companies in the economically sensitive automobile and housing industries for investment in Chancellor’s equity portfolio. Prior to joining Chancellor, Mr. Moeller was an Economist at Citibank from 1979 to 1984. He also analyzed pricing behavior in the metals industry for the Council on Wage and Price Stability in Washington, D.C. In 1999, Mr. Moeller received the award for most accurate forecast from the Forecasters' Club of New York. From 1990 to 1992 he was President of the New York Association for Business Economists. Mr. Moeller earned an M.B.A. in Finance from Fordham University, where he graduated in 1987. He holds a Bachelor of Arts in Economics from George Washington University.
More Economy in Brief


