 Global| Jul 08 2005
U.S. Payrolls Up, Unemployment Down
by:Tom Moeller
|in:Economy in Brief
Summary
Non-farm payrolls rose 146,000 last month following an upwardly revised 104,000 rise in May. While the latest increase disappointed Consensus expectations for a rise of 183,000, it continued the pace of job growth of roughly 1.5% in [...]
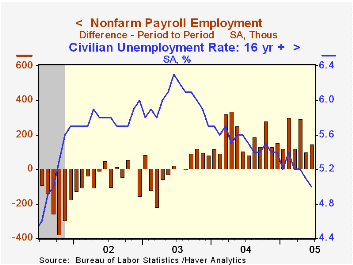
Non-farm payrolls rose 146,000 last month following an upwardly revised 104,000 rise in May. While the latest increase disappointed Consensus expectations for a rise of 183,000, it continued the pace of job growth of roughly 1.5% in place for the last year.
The unemployment rate from the household survey fell to its lowest level since September 2001. At 5.0%, the rate reflected a 165,000 (1.8% y/y) rise in employment and a 1,000 (1.2% y/y) rise in the labor force. The labor force participation rate dipped slightly to 66.0% reflecting an increase in the number of dropouts from the force after two months of decline. Growth in dropouts rose, as a result, to 1.3% y/y though that remained down from the high of 3.7% late in 2003.
Factory sector payrolls fell 24,000 and suffered the worst month of job loss since January, led lower by an 18,000 (-2.6% y/y) worker decline in the motor vehicle industry. A 12,000 (-1.6% y/y) decline in nondurable goods reflected widespread industry declines but were notable at textile mills (-6.1% y/y) and in apparel (-10.5% y/y).
Private service producing industries payrolls rose a firm 148,000 (1.9% y/y) last month led by professional & business services, up 56,000 (3.0% y/y), and education & health services, up 38,000 (2.3% y/y).
Construction jobs rose 18,000 (4.1% y/y) and total government employment rose a modest 2,000 (0.8% y/y). Federal government jobs fell 7,000 (-0.7% y/y) but local gov't employment rose 7,000 (1.0% y/y).
The index of aggregate hours worked (employment times hours worked) rose 0.2% (2.6% y/y) and recovered a revised 0.2% decline in May. The level of hours worked in 2Q rose 2.8% (AR) from 1Q05.
Average hourly earnings rose the same 0.2% as during May and those gains were down from 0.3% during the prior two months.
| Employment | June | May | Y/Y | 2004 | 2003 | 2002 |
|---|---|---|---|---|---|---|
| Payroll Employment | 146,000 | 104,000 | 1.6% | 1.1% | -0.3% | -1.1% |
| Manufacturing | -24,000 | -6,000 | -0.5% | -1.2% | -4.9% | -7.2% |
| Average Weekly Hours | 33.7 | 33.7 | 33.6 | 33.7 | 33.7 | 33.8 |
| Average Hourly Earnings | 0.2% | 0.2% | 2.7% | 2.1% | 2.7% | 2.9% |
| Unemployment Rate | 5.0% | 5.1% | 5.6% | 5.5% | 6.0% | 5.8% |
by Carol Stone July 8, 2005
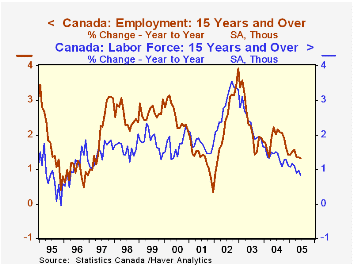
Six months ago, we wrote about labor market conditions in Canada, describing them as a bit shaky after three years of growth. Such hesitancy is still evident in an uneven pattern of employment gains, slow in the first quarter and picking up slightly in the second. Data for June were reported this morning by Statistics Canada. These latest employment increases are sufficient however, to cut the unemployment rate. It reached 6.7% in June, the lowest since June 2000, which in turn was the lowest since March 1976.
Among sectors of the economy, factory employment is continuing an uneven trend. June's modest increase follows a sizable monthly decline in May and the year-on-year performance, at -3.4%, is among the weakest since the recession in the early 1990s. Services are also remarkably sluggish, dragged down – interestingly – by health care and also accommodation and food services. The finance sector and business services, by contrast, are quite strong. Also strong is construction, with a remarkable 12-month increase of 7.6% through June. Persistently low interest rates in Canada, as in the United States, are facilitating considerable building.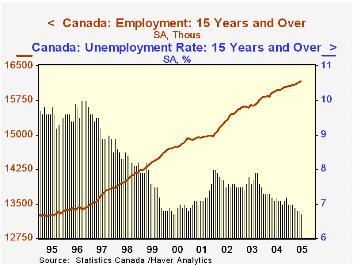
The low unemployment rate would be cause for greater enthusiasm, but for slow growth in the labor force. As evident in the table below and in the second graph, the total number of people working or available for work has shown progressive deceleration. Two of the last three months have seen 12-month percentage changes below 1%, the first time since 1996 that even a single month has been that low.
| Canada Thousands |
June 2005 | May 2005 | June 2004 | 2004 | 2003 | 2002 |
|---|---|---|---|---|---|---|
| Employment | +14 | +35 | +1.3% | +1.8% | +2.3% | +2.4% |
| Manufacturing | +6 | -19 | -3.4% | +0.6% | -0.3% | +2.7% |
| Construction | +21 | -15 | +7.6% | +5.1% | +5.0% | +4.7% |
| Services Producing | -19 | +46 | +1.5% | +1.9% | +2.7% | +2.3% |
| Labor Force | -2 | +41 | +0.8% | +1.4% | +2.3% | +2.9% |
| Unemployment Rate | 6.7% | 6.8% | 7.2% | 7.2% | 7.6% | 7.7% |

Tom Moeller
AuthorMore in Author Profile »Prior to joining Haver Analytics in 2000, Mr. Moeller worked as the Economist at Chancellor Capital Management from 1985 to 1999. There, he developed comprehensive economic forecasts and interpreted economic data for equity and fixed income portfolio managers. Also at Chancellor, Mr. Moeller worked as an equity analyst and was responsible for researching and rating companies in the economically sensitive automobile and housing industries for investment in Chancellor’s equity portfolio. Prior to joining Chancellor, Mr. Moeller was an Economist at Citibank from 1979 to 1984. He also analyzed pricing behavior in the metals industry for the Council on Wage and Price Stability in Washington, D.C. In 1999, Mr. Moeller received the award for most accurate forecast from the Forecasters' Club of New York. From 1990 to 1992 he was President of the New York Association for Business Economists. Mr. Moeller earned an M.B.A. in Finance from Fordham University, where he graduated in 1987. He holds a Bachelor of Arts in Economics from George Washington University.
More Economy in Brief


