 Global| Nov 02 2007
U.S. Payrolls Rose Double Expectations
by:Tom Moeller
|in:Economy in Brief
Summary
Nonfarm payrolls increased 166,000 last month. The gain was double the rise expected by the consensus of economists, although the increase in September jobs was revised slightly downward to 96,000 from the 110,000 reported last month. [...]
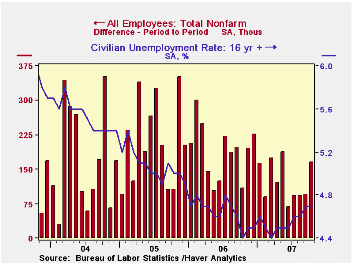
Nonfarm payrolls increased 166,000 last month. The gain was double the rise expected by the consensus of economists, although the increase in September jobs was revised slightly downward to 96,000 from the 110,000 reported last month.
An increase in private service sector jobs in October added nearly all of the heft to last month's job gain. The increase of 154,000 was provided by a 65,000 (2.1% y/y) rise in professional & business service jobs and a 7,500 (3.1% y/y) rise in jobs in the education sector. Additionally, 35,100 (3.2% y/y) jobs were added in the health care sector and the leisure industry added 56,000 (3.3% y/y) workers. These gains offset weak or negative growth elsewhere in service sector jobs.
In what is perhaps a positive sign for future growth in jobs, employment in the temporary help industry rose 20,200 (-1.6% y/y) and offset all of the prior month's decline.
Employment in the government sector also rose a respectable
36,000 (1.0% y/y).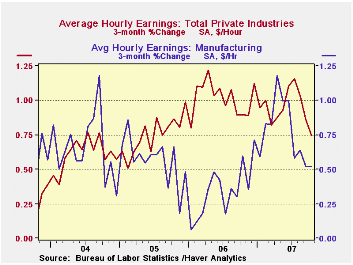
Factory sector payrolls fell another 21,000, adding to a decline that began early last year. Again, these declines are at odds with the recent ISM reports of job growth in manufacturing. Construction employment fell by 5,000 last month after a 14,000 worker decline during September.
Average hourly earnings increased 0.2% and the prior month's gain was revised down slightly. Factory sector earnings rose 0.1% (2.9% y/y) and private service-providing earnings rose 0.2% (3.9% y/y).
The unemployment rate held steady at 4.7%
last month. Household employment fell 250,000 (+0.5% y/y) and offset
about half of the prior month's surge while the labor force fell
211,000 (+1.8% y/y) after jumping 573,000 in September. The labor force
participation rate fell slightly to 65.9% and that was down from 66.2%
during all of last year.
| Employment : 000s | October | September | August | Y/Y | 2006 | 2005 | 2004 |
|---|---|---|---|---|---|---|---|
| Payroll Employment | 166 | 96 | 93 | 1.2% | 1.9% | 1.7% | 1.1% |
| Previous | -- | 110 | 93 | -- | -- | -- | -- |
| Manufacturing | -21 | -17 | -45 | -1.4% | -0.2% | -0.6% | -1.3% |
| Construction | -5 | -14 | -29 | -1.4% | 4.8% | 5.2% | 3.6% |
| Average Weekly Hours | 33.8 | 33.8 | 33.8 | 33.9 (Oct '06) | 33.8 | 33.8 | 33.7 |
| Average Hourly Earnings | 0.2% | 0.3% | 0.3% | 3.8% | 3.9% | 2.8% | 2.1% |
| Unemployment Rate | 4.7% | 4.7% | 4.6% | 4.4% (Oct '06) | 4.6% | 5.1% | 5.5% |
by Tom Moeller November 2, 2007
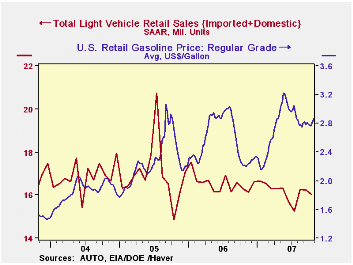
U.S. sales of light vehicles last month fell 1.1% from September to a 16.06M unit annual selling rate. That followed the slight 0.3% decline during September, according to the Autodata Corporation.
Domestically made vehicle sales fell 2.5% m/m to 12.08M (-2.1% y/y). Sales of domestic light trucks again seemed to show the effects of higher gas prices and were down 2.9% m/m to a 7.07M selling rate (-3.4% y/y. Meanwhile, sales of U.S. made cars more than reversed the September increase with a 1.9% decline to 5.06M units last month (-0.4% y/y).
Sales of the relatively fuel efficient imported
light vehicles posted another gain. The 3.4% rise to 3.88M units (0.1%
y/y) was to near the average level of sales during the
record year of 2006. Sales look to be rising another 5% this year.
Imported light truck sales rose 1.3% last month (-0.8% y/y) and sales
of imported autos rose 4.7% to 2.46M units (0.7% y/y).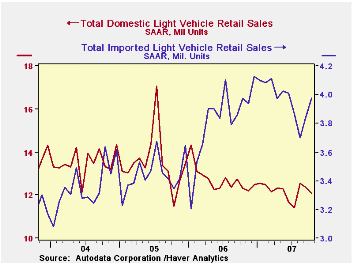
Import's share of the U.S. light vehicle market rose to 24.8% versus an average 23.1% for all of last year.
The statement accompanying this week's FOMC meeting can be found here.
| Light Vehicle Sales (SAAR, Mil. Units) | October | September | Y/Y | 2006 | 2005 | 2004 |
|---|---|---|---|---|---|---|
| Total | 16.05 | 16.23 | -1.6% | 16.55 | 16.96 | 16.87 |
| Autos | 7.47 | 7.45 | 0.0% | 7.77 | 7.65 | 7.49 |
| Domestic | 5.06 | 5.10 | -0.4% | 5.31 | 5.40 | 5.36 |
| Imported | 2.46 | 2.35 | 0.7% | 2.45 | 2.25 | 2.14 |
| Trucks | 8.59 | 8.77 | -2.9% | 8.78 | 9.32 | 9.37 |
| Domestic | 7.07 | 7.28 | -3.4% | 7.42 | 8.12 | 8.15 |
| Imported | 1.52 | 1.50 | -0.8% | 1.37 | 1.20 | 1.23 |
by Robert Brusca November 2, 2007
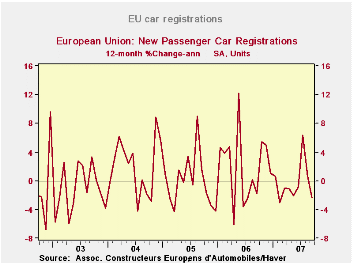
Car registrations rose in the EU by 1.9% in August, their second monthly gain in a row. Still, sales trends are uncertain after some real volatility from February through July. Except for a real spike in July flanked by two severe months of declines, car registrations have been downbeat. The EU numbers today are completed by release of the French car registration figures that show a decline in August. With two months gone in the third quarter, car registrations are dropping at a 14% annual rate in France. For the EU, car registrations are up at a 10% pace in Q3. For August, a rebound in Germany and strength in Italy have helped to push the registration numbers up for EMU in face of declines in the UK and France. On the whole, though, car sales are as irregular as ever and hard to count on.
| EU Car Registrations | ||||||
|---|---|---|---|---|---|---|
| Month-to-month | Saar | |||||
| Aug-07 | Jul-07 | Jun-07 | 3-Mo | 6-Mo | 12-Mo | |
| EU Total | 1.9% | 1.8% | -7.5% | -15.3% | 11.5% | 0.7% |
| from 3Mo Moving average | -1.4% | 2.6% | -0.6% | 2.0% | 1.6% | 2.0% |
| Country detail | ||||||
| Germany | 6.3% | 3.0% | -4.7% | 18.0% | 56.5% | -2.1% |
| France | -3.9% | 3.2% | -1.4% | -8.8% | -1.3% | -1.8% |
| Italy | 10.5% | -10.5% | -5.2% | -22.9% | 4.7% | 7.3% |
| Spain | 5.3% | -2.4% | -6.2% | -13.6% | 10.5% | -2.8% |
| UK | -20.0% | 2.4% | 0.3% | -54.4% | -29.4% | 1.3% |
| All SA France also working day adjusted | ||||||
by Robert Brusca November 2, 2007
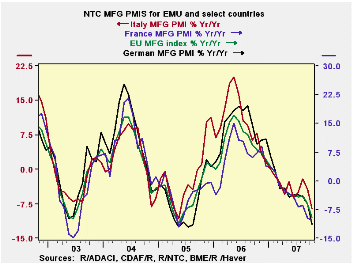
Is the thrill gone?EMU indexes stand more or less mid range.
In October the MFG PMIs are losing momentum. The chart on the
left shows the year-over-year percentage drops in the levels of the
index for key EMU countries. Although the various nations are at
different levels in terms of their respective MFG indexes they are all
declining in a very sympathetic bunched fashion.
The big countries - Germany, France, Italy and Spain – all
have indexes clustered just north of their 50 breakeven marks. Spain
has slipped below 50, the breakeven point for expansion/contraction. In
terms of their respective range of values we find France and Spain are
lower in their range percentiles. France’s raw reading of 50.54 is in
the bottom 38 percentile of its range even though that PMI reading is
above 50. The MFG PMI in France has simply tended to be stronger than
in other countries.
Some of the smaller countries (Ireland, Greece, Austria and
the Netherlands) have PMI ratings that are much higher in their
respective ranges with raw PMI scores as high as 56. Greece has a PMI
reading that ranks in the top 79th percentile of its range. Right now,
the small countries of Europe are the ones pressing the advance for MFG
for EMU as a region.
The UK, an EU member but not an EMU member, has a raw PMI
score of 52.93, higher than any large EMU county and a range reading of
68.8% showing that the UK is also strong in its range of values.
| NTC MFG Indexes | ||||||
|---|---|---|---|---|---|---|
| Oct-07 | Sep-07 | 3-Mo | 6-Mo | 12-Mo | Percentile | |
| Euro-13 | 51.52 | 53.21 | 53.02 | 54.09 | 54.96 | 52.2% |
| Germany | 51.67 | 54.87 | 54.17 | 55.44 | 56.67 | 55.2% |
| France | 50.54 | 50.51 | 51.20 | 52.50 | 53.27 | 38.1% |
| Italy | 51.34 | 52.39 | 52.45 | 53.28 | 53.74 | 56.1% |
| Spain | 49.58 | 50.80 | 50.85 | 52.35 | 54.27 | 44.7% |
| Austria | 52.77 | 55.37 | 54.21 | 54.00 | 55.24 | 60.8% |
| Greece | 55.27 | 53.83 | 54.22 | 54.03 | 53.13 | 79.6% |
| Ireland | 52.27 | 54.35 | 53.66 | 53.33 | 52.94 | 67.9% |
| Netherlands | 56.15 | 56.36 | 56.23 | 56.98 | 56.72 | 78.6% |
| EU | ||||||
| UK | 52.93 | 54.73 | 54.54 | 54.75 | 54.21 | 68.8% |
| percentile is over range since March 2000 | ||||||
Tom Moeller
AuthorMore in Author Profile »Prior to joining Haver Analytics in 2000, Mr. Moeller worked as the Economist at Chancellor Capital Management from 1985 to 1999. There, he developed comprehensive economic forecasts and interpreted economic data for equity and fixed income portfolio managers. Also at Chancellor, Mr. Moeller worked as an equity analyst and was responsible for researching and rating companies in the economically sensitive automobile and housing industries for investment in Chancellor’s equity portfolio. Prior to joining Chancellor, Mr. Moeller was an Economist at Citibank from 1979 to 1984. He also analyzed pricing behavior in the metals industry for the Council on Wage and Price Stability in Washington, D.C. In 1999, Mr. Moeller received the award for most accurate forecast from the Forecasters' Club of New York. From 1990 to 1992 he was President of the New York Association for Business Economists. Mr. Moeller earned an M.B.A. in Finance from Fordham University, where he graduated in 1987. He holds a Bachelor of Arts in Economics from George Washington University.
More Economy in Brief
 Global| Feb 05 2026
Charts of the Week: Balanced Policy, Resilient Data and AI Narratives
by:Andrew Cates


