 Global| Nov 07 2008
U.S. Payrolls Off 240,000 in October; 6.5% Jobless Rate Highest Since 1994
by:Tom Moeller
|in:Economy in Brief
Summary
October Nonfarm payrolls declined 240,000, according to the Bureau of Labor Statistics. The decline, which exceeded Consensus expectations for a 198,000 drop, followed a revised 284,000 September decline that was much deeper than [...]
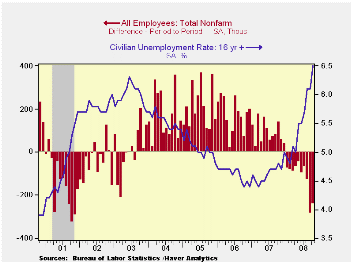
October Nonfarm payrolls declined 240,000, according to the Bureau of Labor Statistics. The decline, which exceeded Consensus expectations for a 198,000 drop, followed a revised 284,000 September decline that was much deeper than reported initially. So far in 2008, nonfarm payrolls are down 1.179 mil., or 0.9%.
During the last three months, payrolls fell at a 1.9% annual rate. That is the quickest rate of decline during this cycle and it now matches the rate of decline at the end of the 2001 recession.
The unemployment rate jumped to 6.5% last month, the highest level since March 1994. The increase also exceeded Consensus expectations for a rise to 6.3%. The jump owed to a 297,000 drop in employment (-0.7% y/y), as measured in the household survey. The latest decline in household sector employment was the eighth, and second largest, monthly decline this year.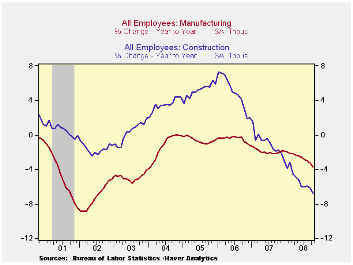
The number of those who were unemployed last month rose 603,000 (38.3% y/y) and the number is up 2.425 mil. so far this year. The labor force rose 306,000 (+1.1% y/y) during October and that rate of increase has been steady. The labor force participation rate increased slightly to 66.1%. The number of people of who want a job but are not in the labor force fell last month but the figure is up 16.4% y/y, the most in over ten years.
The average duration of unemployment increased by more than one full week to 19.7 and the median duration of unemployment rose to a lesser 10.6 weeks, up from 8.5 weeks during all of last year. The number of those unemployed for more than 27 weeks increased 12.4% and that figure is up by three quarters over the last twelve months, the most since 2002.
From the establishment survey the number of private sector jobs fell 263,000 (-1.1% y/y) after a 243,000 September decline, initially reported down by 168,000. Private service sector industries shed 131,000 jobs (-0.4% y/y) and that was the ninth decline in the last ten months. Employment in trade, transportation & utilities accounted for roughly half of that October decrease while retail sector jobs fell another 38,100 (-1.8% y/y) with motor vehicle dealerships (-4.8% y/y) accounting for most of the decline. Jobs in the information sector were unchanged last month (-1.5% y/y) but financial sector jobs fell 24,000 (-1.5% y/y). The professional & business service industry shed 45,000 (-1.7% y/y) jobs after a 39,000 September decline (Here was where half of the big downward revision for September occurred). Temporary help services jobs which often are a leading indicator of employment growth, fell 36,600 (-11.6% y/y), the largest y/y decline since 2002. These declines were somewhat offset by a gain in education & health industries jobs of 21,000 (2.8% y/y) but here again, revisions were big. The previously reported September gain of 25,000 now shows a 16,000 decline.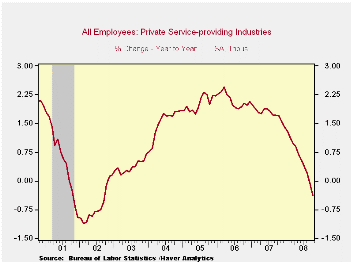
Construction sector employment fell by 49,000 during October, the largest decline since June.
Factory sector jobs fell 90,000 (-3.7% y/y) after a little revised 56,000 worker decline during September. Motor vehicle & parts jobs fell 9,100 (-13.5% y/y) and furniture & parts jobs fell by 10,400 (-10.8% y/y. In the nondurables sector employment fell 15,000 (-2.4% y/y).
Government sector jobs moved higher by 23,000 (1.1% y/y). The gain followed a decline of 41,000 during September which initially was reported as a slight increase. (This was the source of the other half of the downward September revision in total nonfarm jobs.) Local governments added 21,000 (1.0% y/y) workers while the federal government added 6,000 (1.2% y/y) workers.
Comparing Current Payroll Employment Changes with Past Recessions from the Federal Reserve Bank of Cleveland is available here.
The length of the average workweek held steady m/m at 33.6 hours, down slightly from the 3Q average.
Suggesting continued declines in employment was the one month diffusion index, which measures the breadth of job gain or loss (50 is the break-even level). It fell to its lowest level of this cycle (37.6%). The three-month index also was near its cycle low at 37.0% and the three-month figure for the factory sector was even weaker at 25.0%.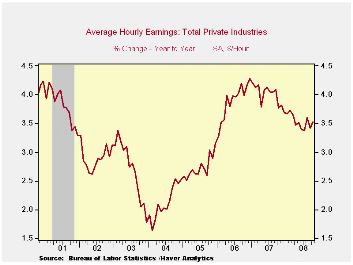
Average hourly earnings rose a modest 0.2%, as they did in September. A weaker employment market cooled wage increases in the factory sector where earnings fell 0.1% (+2.8% y/y). A 0.1% increase in the private services wages also indicated softness. The y/y gain eased to 3.5%, down from a 5.0% high during 2006.
The Promise and Peril of the New Financial Architecture is yesterday's speech by Fed Governor Kevin Warsh and it can be found here.
| Employment: 000s | October | September | August | Y/Y | 2007 | 2006 | 2005 |
|---|---|---|---|---|---|---|---|
| Payroll Employment | -240 | -284 | -127 | -0.8% | 1.1% | 1.8% | 1.7% |
| Previous | -- | -159 | -73 | -- | 1.3% | 1.9% | 1.7% |
| Manufacturing | -90 | -56 | -40 | -3.7% | -1.9% | -0.5% | -0.6% |
| Construction | -49 | -35 | -20 | -6.7% | -1.0% | 4.9% | 5.2% |
| Service Producing | -108 | -201 | -57 | -0.1% | 1.6% | 1.8% | 1.8% |
| Average Weekly Hours | 33.6 | 33.6 | 33.7 | 33.8 (Oct. '07) | 33.8 | 33.9 | 33.8 |
| Average Hourly Earnings | 0.2% | 0.2% | 0.4% | 3.5% | 4.0% | 3.9% | 2.7% |
| Unemployment Rate | 6.5% | 6.1% | 6.1% | 4.8% (Oct. '07) | 4.6% | 4.6% | 5.1% |

Tom Moeller
AuthorMore in Author Profile »Prior to joining Haver Analytics in 2000, Mr. Moeller worked as the Economist at Chancellor Capital Management from 1985 to 1999. There, he developed comprehensive economic forecasts and interpreted economic data for equity and fixed income portfolio managers. Also at Chancellor, Mr. Moeller worked as an equity analyst and was responsible for researching and rating companies in the economically sensitive automobile and housing industries for investment in Chancellor’s equity portfolio. Prior to joining Chancellor, Mr. Moeller was an Economist at Citibank from 1979 to 1984. He also analyzed pricing behavior in the metals industry for the Council on Wage and Price Stability in Washington, D.C. In 1999, Mr. Moeller received the award for most accurate forecast from the Forecasters' Club of New York. From 1990 to 1992 he was President of the New York Association for Business Economists. Mr. Moeller earned an M.B.A. in Finance from Fordham University, where he graduated in 1987. He holds a Bachelor of Arts in Economics from George Washington University.
More Economy in Brief


