 Global| Feb 03 2006
U.S. Payrolls Just Below Expectations, Jobless Rate Lowest Since 2001
by:Tom Moeller
|in:Economy in Brief
Summary
In January, non-farm payrolls rose 193,000 following a December increase revised to 140,000 from the 108,000 reported last month. In addition, the November increase was revised up further 354,000 from last month's reported 305,000 [...]
In January, non-farm payrolls rose 193,000 following a December increase revised to 140,000 from the 108,000 reported last month. In addition, the November increase was revised up further 354,000 from last month's reported 305,000 gain and from 215,000 reported initially. Consensus expectations had been for a 250,000 January increase.
Benchmark revisions of the establishment survey data extended back to 2001. For 2005, the average monthly increase in payrolls was revised down to 165,000 from 179,300, but the average gain during 2004 was revised up to 175,000 from 123,000.
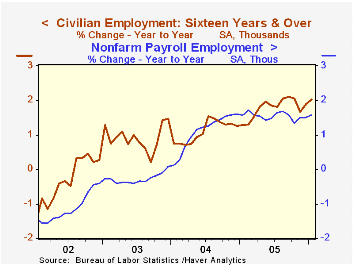
From the household survey the unemployment rate fell to the lowest level since July 2001. At 4.7%, the rate reflected a 295,000 (2.0% y/y) rise in employment and a 39,000 (1.5% y/y) decline in the labor force. A 4.9% unemployment rate had been the Consensus expectation for January.
Factory sector payrolls increased modestly following a downwardly revised December decline and the average gain in factory payrolls during the last three months of 2005 was revised slightly lower to 9,000. Nevertheless, the breadth of gain in factory payrolls rose to 52.4%, its best since July 2004.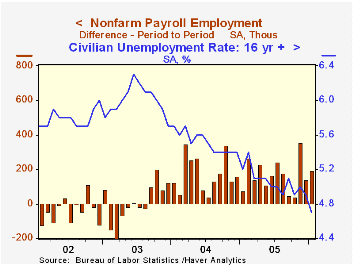
Warm weather helped lift construction employment in January by 46,000 (4.8% y/y) following an upwardly revised 5,000 increase during December.
Private service producing payrolls rose the same 136,000 (1.8% y/y) in January as during an upwardly revised December despite a 1,500 decline in retail employment (+1.0% y/y). That decline was offset by a 21,000 (1.9% y/y) gain in finance and a 24,000 (3.1% y/y) increase in professional & business services. Education & health services jobs posted a 39,000 (2.1% y/y) increase while jobs in leisure & hospitality rose 26,000 (2.0% y/y).
Government sector employment fell 1,000 (+0.7% y/y) for the third decline in the last four months. Federal hiring fell 5,000 (-0.5% y/y) and state & local jobs increased 4,000 (0.9% y/y).
Average hourly earnings again were a bit stronger than expected, rising 0.4%. Factory sector earnings rose 0.2% (2.2% y/y) and private service producing wages rose 0.4% (3.5% y/y).
2006: A Year of Transition at the Federal Reserve from the Federal Reserve Bank of San Francisco can be found here.
| Employment | Jan | Dec | Y/Y | 2005 | 2004 | 2003 |
|---|---|---|---|---|---|---|
| Payroll Employment | 193,000 | 140,000 | 1.6% | 1.6% | 1.1% | -0.3% |
| Manufacturing | 7,000 | -1,000 | -0.3% | -0.6% | -1.3% | -4.9% |
| Average Weekly Hours | 33.8 | 33.8 | 33.7 (Jan '05) | 33.8 | 33.7 | 33.7 |
| Average Hourly Earnings | 0.4% | 0.4% | 3.3% | 2.8% | 2.1% | 2.7% |
| Unemployment Rate | 4.7% | 4.9% | 5.2% (Jan '05) | 5.1% | 5.5% | 6.0% |
by Tom Moeller February 3, 2006
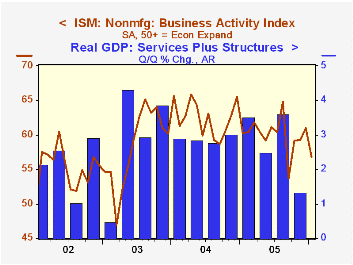
The Institute for Supply Management (ISM) reported that the Business Activity Index for the non-manufacturing sector fell last month to 56.8 from an upwardly revised 61.0 in December. A reading above 50 indicates expansion. The latest reading was weaker than Consensus expectations for a decline to 59.5.
Since the series' inception in 1997 there has been a 53% correlation between the level of the Business Activity Index and the q/q change in real GDP for services plus construction.
The new orders component slipped sharply to its lowest level since May 2003 and the employment index, though still indicating growth at 51.1, was at its lowest since July 2004. Since the series' inception in 1997 there has been a 60% correlation between the level of the ISM non-manufacturing employment index and the m/m change in payroll employment in the service producing plus the construction industries.
Pricing power was stable last month with December. Since inception eight years ago, there has been a 70% correlation between the price index and the y/y change in the GDP Services chain price index.
ISM surveys more than 370 purchasing managers in more than 62 industries including construction, law firms, hospitals, government and retailers. The non-manufacturing survey dates only to July 1997, therefore its seasonal adjustment should be viewed tentatively.Business Activity Index for the non-manufacturing sector reflects a question separate from the subgroups mentioned above. In contrast, the NAPM manufacturing sector composite index is a weighted average five components.
| ISM Nonmanufacturing Survey | Jan | Dec | Jan '05 | 2005 | 2004 | 2003 |
|---|---|---|---|---|---|---|
| Business Activity Index | 56.8 | 61.0 | 60.3 | 60.1 | 62.5 | 58.3 |
| Prices Index | 67.2 | 67.2 | 66.8 | 67.9 | 68.8 | 56.6 |
by Tom Moeller February 3, 2006
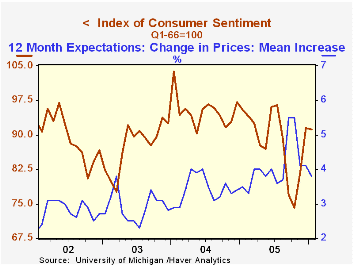
The University of Michigan reported that consumer sentiment for all of January fell a slight 0.3% from December to 91.2. The decline was due to a fall late in the month and compared to an initial read of 93.4. Consensus expectations had been for 93.0 for the full month.
During the last ten years there has been a 76% correlation between the level of consumer sentiment and the y/y change in real consumer spending.
The current conditions index rose just 1.1% compared to a mid-month 2.7% increase. The reading of buying conditions for large household goods rose less than initially estimated and the reading of personal finances showed the same, slight decline (-4.1% y/y). Consumers' assessment of gov't economic policy (-11.2% y/y) improved to the highest level since July.
Consumers' expectations slipped 1.6% instead of increasing that amount as indicated mid-month. Expectations for personal finances fell sharply (-9.8% y/y).
The mean expected inflation rate for the next twelve months increased to 3.8% from 3.5% expected mid-month.
The University of Michigan survey is not seasonally adjusted.The mid-month survey is based on telephone interviews with 250 households nationwide on personal finances and business and buying conditions. The survey is expanded to a total of 500 interviews at month end.
| University of Michigan | Jan | Dec | Y/Y | 2005 | 2004 | 2003 |
|---|---|---|---|---|---|---|
| Consumer Sentiment | 91.2 | 91.5 | -4.5% | 88.6 | 95.2 | 87.6 |
| Current Conditions | 110.3 | 109.1 | -0.5% | 105.9 | 105.6 | 97.2 |
| Expectations | 78.9 | 80.2 | -7.9% | 77.4 | 88.5 | 81.4 |
by Tom Moeller February 3, 2006
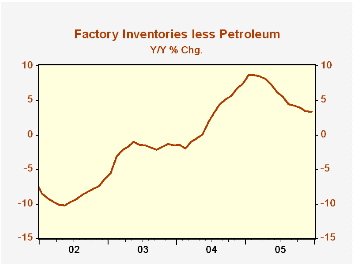
Factory inventories grew 0.5% during December following an upwardly revised 0.3% increase during November. During the year, the rate of inventory accumulation slowed to 4.3% from 7.7% during 2004.
The rise last year in oil prices actually dampened the degree of that slowdown. During 2005, petroleum refineries' inventories rose 26.0%. Less oil, factory inventories rose 3.4%, down from a 7.4% gain during 2004 and down from a 8.7% rate of accumulation early in the year.
December inventory accumulation was paced by a 0.8% (4.7% y/y) increase in primary metal which was the first monthly increase since May. Electrical equipment inventories also rose a strong 1.0% (5.7% y/y) but inventories of computers & electronic products fell 0.9% (0.5% y/y) and that y/y gain was down from +7.1% last January. Machinery inventories rose just 0.1% (6.4% y/y), half the annual rate of accumulation early in the year.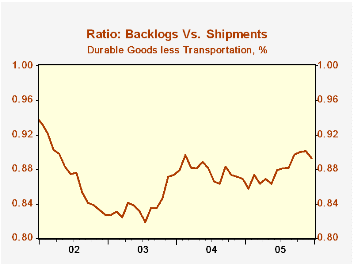
Factory shipments surged 2.2% but the gain was pumped by a 14.4% (83.8% y/y) rise in nondefense aircraft and a 4.2% (-0.2% y/y) gain in motor vehicles & parts. Less transportation altogether as well as petroleum, shipments rose 0.9% (5.1% y/y).
Total factory orders rose 1.1% and the advance report of a 1.3% rise in durable goods orders was revised up to 1.8%.
Unfilled orders surged another 2.4% powered by a 7.6% (55.8% y/y) rise in backlogs for nondefense aircraft orders. Less the transportation sector, backlogs rose 0.5% (10.0% y/y) and the ratio of total unfilled orders to shipments fell.
| Factory Survey (NAICS) | Dec | Nov | Y/Y | 2005 | 2004 | 2003 |
|---|---|---|---|---|---|---|
| Inventories | 0.5% | 0.3% | 4.3% | 4.3% | 7.7% | -1.1% |
| New Orders | 1.1% | 3.3% | 10.5% | 8.4% | 9.3% | 3.5% |
| Shipments | 2.2% | 0.8% | 7.2% | 7.4% | 9.5% | 1.5% |
| Unfilled Orders | 2.4% | 3.1% | 16.3% | 16.3% | 8.4% | 8.0% |
by Carol Stone February 3, 2006
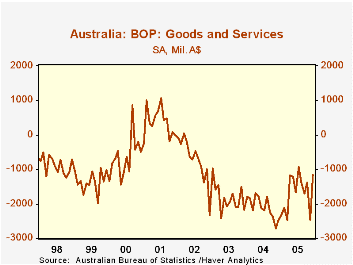
International trade for Australia looks to be very dynamic process. The trade balance widened to a significant deficit in 2003 and 2004, but moderated considerably in 2005, mirroring a pattern of decline and then rapid turnaround in exports. Exports fell 9.3% in 2003, but recovered almost exactly that amount in 2004. Then last year, they surged ahead 17.8% for the year as a whole, with 9.0% in the month of December alone over November. Exports in December, as seen in the table below, grew a whopping 28.5% from December 2004.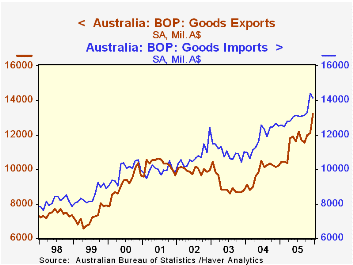
At the same time, imports have not been sluggish, as they were up 10% for 2005 as a whole. As elsewhere, some of this was oil-price related, with imports of mineral fuels, lubricants and related up 34% for the year, following 28% in 2004. Chemicals also rose by more than 10%. Other manufactured goods weren't that strong, but they gained in a range of 8%-9%, so they were hardly weak.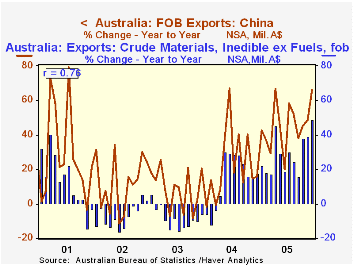
The two most interesting developments in Australian trade -- at least in our view -- concern metals exports and exports to China. These may be related, but available data can't confirm that. The third graph is very suggestive, however. Exports to China rose 45.5% in 2005, with a final spurt in December carrying them to A$1.8 billion, up nearly 66% from December 2004. (For comparison, shipments to the US, which were larger than those to China as recently as 2003, were relatively flat at about A$800 million/month from then until late last year.) Among kinds of goods Australia has exported, non-food crude materials also increased substantially, 29% for the year and 49% December-on-December. Over the past five years, the monthly pattern of the year-to-year changes in these raw materials has a 76% correlation with growth in exports to China. Australia is a major producer of copper and aluminum; it may well be that they are shipping considerable quantities of those metals to their large neighbor to the north. This would bode well for both countries, a fine illustration of the "gains from trade", and would help minimize Australia's trade deficit with China.
| Australia Trade (Mil.A$) | Month/MonthYr/Yr | Monthly Average||||||
|---|---|---|---|---|---|---|---|
| Dec 2005* | Nov 2005* | Oct 2005* | Dec 2004* | 2005 | 2004 | 2003 | |
| Goods & Services: Balance | -1168 | -2473 | -1371 | -2480 | -1668 | -2102 | -1818 |
| Goods: Exports | 13214 | 12129 | 11999 | 10229 | 11619 | 9848 | 9067 |
| % Change | 9.0 | 1.1 | 3.8 | 28.5** | 17.8 | 9.4 | -9.3 |
| Goods: Imports | 14150 | 14227 | 13285 | 12502 | 13163 | 11875 | 10974 |
| % Change | -1.9 | 8.6 | 1.1 | 9.3** | 10.1 | 8.7 | 1.7 |
| China: Exports (NSA) | 1827 | 1419 | 1509 | 1102 | 1336 | 918 | 757 |
| USA: Exports (NSA) | 914 | 840 | 773 | 835 | 772 | 796 | 788 |
Tom Moeller
AuthorMore in Author Profile »Prior to joining Haver Analytics in 2000, Mr. Moeller worked as the Economist at Chancellor Capital Management from 1985 to 1999. There, he developed comprehensive economic forecasts and interpreted economic data for equity and fixed income portfolio managers. Also at Chancellor, Mr. Moeller worked as an equity analyst and was responsible for researching and rating companies in the economically sensitive automobile and housing industries for investment in Chancellor’s equity portfolio. Prior to joining Chancellor, Mr. Moeller was an Economist at Citibank from 1979 to 1984. He also analyzed pricing behavior in the metals industry for the Council on Wage and Price Stability in Washington, D.C. In 1999, Mr. Moeller received the award for most accurate forecast from the Forecasters' Club of New York. From 1990 to 1992 he was President of the New York Association for Business Economists. Mr. Moeller earned an M.B.A. in Finance from Fordham University, where he graduated in 1987. He holds a Bachelor of Arts in Economics from George Washington University.


