 Global| Mar 04 2005
U.S. Payrolls Firm
by:Tom Moeller
|in:Economy in Brief
Summary
Non-farm payrolls rose 262,000 in February, doubling the prior month's increase which was downwardly revised. Consensus expectations had been for a 225,000 rise. From the separate household survey the unemployment rate rose to 5.4%. [...]
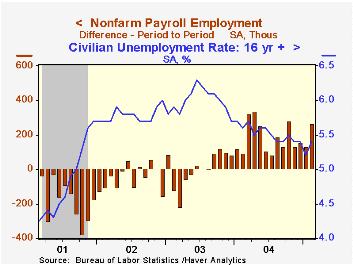
Non-farm payrolls rose 262,000 in February, doubling the prior month's increase which was downwardly revised. Consensus expectations had been for a 225,000 rise.
From the separate household survey the unemployment rate rose to 5.4%. Employment fell 97,000 (+1.3% y/y) while the labor force expanded 153,000 (1.1% y/y). The labor force participation rate remained stable m/m at 65.8% versus a high in 2000 of 67.3%.
Factory sector payrolls recovered all of the lessened 20,000 January decline. The breadth of hiring gain narrowed, however, as indicated by a decline in the one month diffusion index to 43.5%. That index rose above 60% early in 2004.
Construction jobs rose 30,000 (4.0% y/y) versus a revised no change in January.
Private service producing payrolls rose 174,000 (2.1% y/y) led by a strong 81,000 (3.9% y/y) gain in professional & business services. Education & health services jobs rose 18,000 (2.4% y/y) and financial jobs rose 12,000 (2.1% y/y). Government employment increased 33,000 (0.9% y/y) though federal government jobs rose just 2,000 (-0.4% y/y).
The index of aggregate hours worked (employment times hours worked) rose 0.2% (+2.2% y/y) after an upwardly revised 0.2% January gain. In 1Q the index is 0.6% (AR) ahead of 4Q04.
Average hourly earnings rose were unchanged reflecting a 0.1% (+2.6% y/y) in private service producing earnings. Manufacturing earnings rose 0.2% (2.6% y/y).
Yesterday's speech by Fed Chairman Alan Greenspan on the tax system can be found here.
| Employment | Feb | Jan | Y/Y | 2004 | 2003 | 2002 |
|---|---|---|---|---|---|---|
| Payroll Employment | 262,000 | 132,000 | 1.8% | 1.1% | -0.3% | -1.1% |
| Manufacturing | 20,000 | -20,000 | 0.4% | -1.2% | -4.9% | -7.2% |
| Average Weekly Hours | 33.7 | 33.7 | 33.8 | 33.7 | 33.7 | 33.8 |
| Average Hourly Earnings | 0.0% | 0.3% | 2.5% | 2.1% | 2.7% | 2.9% |
| Unemployment Rate | 5.4% | 5.2% | 5.6% | 5.5% | 6.0% | 5.8% |
by Tom Moeller March 4, 2005
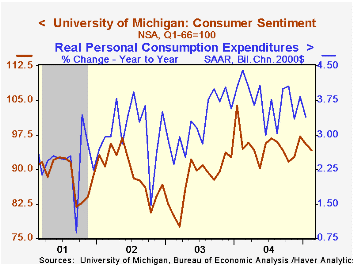
The February index of consumer sentiment from the University of Michigan fell to 94.1 versus the preliminary reading of 94.2 and 95.5 in January. Consensus expectations had been for 94.2. During the last ten years there has been a 74% correlation between the level of consumer sentiment and the y/y change in real PCE.
Consumer expectations fell 1.5% m/m but the decline was slightly less than initially estimated.
The reading of current conditions fell 1.5% m/m versus the preliminary read of no change. Sentiment regarding personal finances fell m/m but surged 9.0% vs. a year ago. During the last ten years there has been an 81% correlation between the current conditions index and y/y growth in payroll employment. Buying conditions for large household goods fell m/m but rose last quarter versus 4Q04.
The University of Michigan survey is not seasonally adjusted.The mid-month survey is based on telephone interviews with 250 households nationwide on personal finances and business and buying conditions. The survey is expanded to a total of 500 interviews at month end.
| University of Michigan | Feb | Jan | Y/Y | 2004 | 2003 | 2002 |
|---|---|---|---|---|---|---|
| Consumer Sentiment | 94.1 | 95.5 | -0.3% | 95.2 | 87.6 | 89.6 |
| Current Conditions | 109.2 | 110.9 | 5.4% | 105.6 | 97.2 | 97.5 |
| Consumer Expectations | 84.4 | 85.7 | -4.6% | 88.5 | 81.4 | 84.6 |
by Tom Moeller March 4, 2005
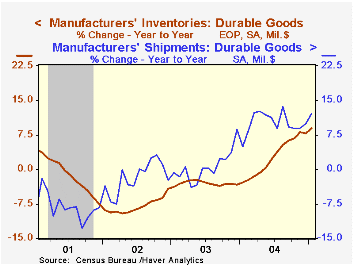
Factory inventories jumped 1.3% in January led higher by broad based industry gains. Less petroleum which jumped 8.6% (18.3% y/y), inventories increased 1.0% (8.1% y/y).
Shipments out of the factory sector surged 1.4% but were notable for primary metals (32.0% y/y), machinery (20.6% y/y), computers & electronics (11.1% y/y) and chemicals (11.7% y/y).
Orders to the factory sector rose 0.2%. The advance report of a 0.9% decline in durable goods was revised deeper to 1.3% (+11.4% y/y). Nondefense capital goods orders less aircraft was unrevised at +2.9% (17.1% y/y).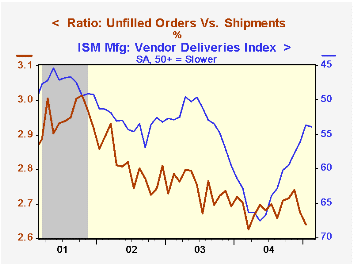
Unfilled orders fell 0.2% for the first decline in a year. Fewer supply bottlenecks were indicated as the ratio of unfilled orders to shipments for durables fell sharply for the second month.
| Factory Survey (NAICS) | Jan | Dec | Y/Y | 2004 | 2003 | 2002 |
|---|---|---|---|---|---|---|
| Inventories | 1.3% | 0.1% | 8.5% | 7.5% | -1.3% | -1.8% |
| New Orders | 0.2% | 0.5% | 11.3% | 10.9% | 3.7% | -1.9% |
| Shipments | 1.4% | 1.2% | 11.7% | 10.5% | 2.6% | -2.0% |
| Unfilled Orders | -0.2% | 0.5% | 8.9% | 9.1% | 4.2% | -6.1% |

Tom Moeller
AuthorMore in Author Profile »Prior to joining Haver Analytics in 2000, Mr. Moeller worked as the Economist at Chancellor Capital Management from 1985 to 1999. There, he developed comprehensive economic forecasts and interpreted economic data for equity and fixed income portfolio managers. Also at Chancellor, Mr. Moeller worked as an equity analyst and was responsible for researching and rating companies in the economically sensitive automobile and housing industries for investment in Chancellor’s equity portfolio. Prior to joining Chancellor, Mr. Moeller was an Economist at Citibank from 1979 to 1984. He also analyzed pricing behavior in the metals industry for the Council on Wage and Price Stability in Washington, D.C. In 1999, Mr. Moeller received the award for most accurate forecast from the Forecasters' Club of New York. From 1990 to 1992 he was President of the New York Association for Business Economists. Mr. Moeller earned an M.B.A. in Finance from Fordham University, where he graduated in 1987. He holds a Bachelor of Arts in Economics from George Washington University.
More Economy in Brief


