 Global| Jul 03 2008
U.S. Payrolls Fell for Sixth Month, Jobless Rate Stable at 5.5%
by:Tom Moeller
|in:Economy in Brief
Summary
The Bureau of Labor Statistics reported that nonfarm payrolls fell 62,000 in June. While the decline was in-line with expectations, it was the sixth consecutive monthly drop and it brought the total loss of jobs this year to 438,000. [...]
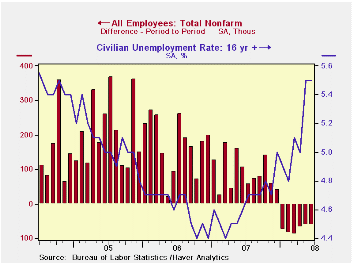
The Bureau of Labor Statistics reported that nonfarm payrolls fell 62,000 in June. While the decline was in-line with expectations, it was the sixth consecutive monthly drop and it brought the total loss of jobs this year to 438,000. During the last three months payrolls fell at a 0.6% annual rate. That compared to a rate of decline in excess of 2.0% by the end of the last recession.
Employment is surveyed during the week that contains the 12th day of the month. Therefore, the effect of floods in the Midwest will become apparent with the July jobs report.
During the second quarter, the level of aggregate hours worked (employment multiplied by hours worked) fell at a 0.9% rate from 1Q. With 2% growth in productivity assumed, that suggests 1% growth in real GDP.
Factory sector jobs fell another 33,000 and at 3.1% rate over the last three months. That was near the fastest rate of decline since 2003 but during the 2001 recession employment dropped at a 10% rate.
Construction sector employment dropped 43,000 and the rate of job loss has been exceptionally large. Falling at a 7.4% rate during the last three months it about matches the worst rate of job loss in the construction sector since 1991.
Hiring in the service sector continued to weaken. Jobs rose
just 7,000 (0.7% y/y), compared to growth of 1.6% to 1.8% during the
last three years.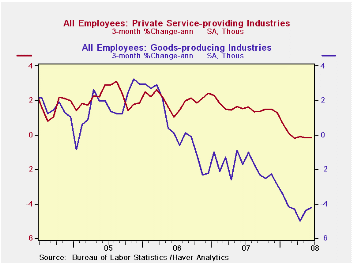
This aggregate understates the weakening in private service sector jobs which fell 22,000 last month for the fifth decline in the last six months. The three-month rate of job loss of -0.2% compares to growth of 1.5% to 2.1% during the prior four years. Retail sector job loss has run at a 2.0% rate during the last three months. Jobs in the information sector also have been lost at a 1.7% rate, the same rate of decline as in the professional & business services sector. These declines have been offset by 4.6% growth in the number of jobs in education and by 2.4% growth health care jobs. The number of finance sector jobs have fallen at a 0.7% rate during the last three months while temporary help services jobs, often a leading indicator of employment growth, have been declining at an accelerated 12.3% rate. Real estate sector jobs have been shed at a 0.4% rate during the last three months which is an improvement from the 3% to 4% rates of job loss late last year and early this year.
Government sector jobs rose an upwardly revised 29,000, the same as during May, and have increased at a 1.5% rate during the last three months. Federal government hiring has been strongest and is up at a 2.8% rate during the last three months followed by 2.3% growth in state employment and 0.9% growth in local government hiring.
The one month diffusion index, which
measures the breadth of job gain or loss (50 is the break-even level)
continued to portend further job loss as it stood at 46.9%. The three-
month index remained even weaker at 41.9%. The three-month figure for
the factory sector was somewhat weaker at 31.0%.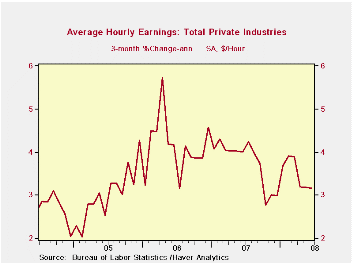
In the Bureau of Labor Statistics household sector survey, the unemployment rate remained stable at 5.5% in June versus expectations for a slight decline. Employment fell a hard 155,000 after the 285,000 May decline. This measure of employment has been roughly unchanged since early-2007. The level of the unemployed rose 12,000 (21.5% y/y) after an 861,000 jump in May.
During June, the labor force fell 144,000 (+0.9% y/y) after its 577,000 surge in May. The labor force participation rate slipped month-to month to 66.1% from 66.2% versus 66.0% during all of last year and 66.2% in 2006.
The average duration of unemployment rose to 17.5 weeks from 16.6 in May. The figure now is on the rise versus the averages of the last two years.
Average hourly earnings increased a steady 0.3% and three-month growth was stable at 3.2% after 4.0% growth during 2006 and 2007. Factory sector earnings rose 2.6% y/y while private service sector earnings rose 3.7% y/y.
Global Financial Turmoil and the World Economy is yesterday's speech by Fed Governor Frederic S. Mishkin and it can be found here.
| Employment: 000s | June | May | April | Y/Y | 2007 | 2006 | 2005 |
|---|---|---|---|---|---|---|---|
| Payroll Employment | -62 | -62 | -67 | 0.0% | 1.1% | 1.8% | 1.7% |
| Previous | -- | -49 | -28 | -- | 1.3% | 1.9% | 1.7% |
| Manufacturing | -33 | -22 | -52 | -2.5% | -1.9% | -0.5% | -0.6% |
| Construction | -43 | -37 | -59 | -5.9% | -1.0% | 4.9% | 5.2% |
| Average Weekly Hours | 33.7 | 33.7 | 33.8 | 33.8 (June '07) | 33.8 | 33.9 | 33.8 |
| Average Hourly Earnings | 0.3 | 0.3% | 0.1% | 3.4% | 4.0% | 3.9% | 2.7% |
| Unemployment Rate | 5.5% | 5.5% | 5.0% | 4.6% (June '07) | 4.6% | 4.6% | 5.1% |
by Tom Moeller July 3, 2008
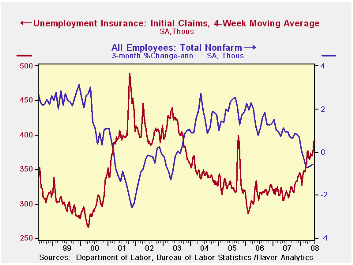
Initial claims for unemployment insurance last week surged to 404,000 versus an upwardly revised 388,000 during the prior week. Consensus expectations had been for 385,000 claims.
A claims level below 400,000 typically has been associated with growth in nonfarm payrolls. During the last ten years there has been a (negative) 76% correlation between the level of initial claims and the m/m change in nonfarm payroll employment.
The four-week moving average of initial claims again rose to 390,500 (22.5% y/y). Claims averaged 369,000 during May. The numbers compare to March when initial claims averaged 375,000.
Continuing claims for unemployment insurance reversed some of the prior week's jump with a 19,000 worker decline. The four-week average of continuing claims rose to a new cycle high of 3,110,750.
Continuing claims provide some indication of workers' ability to find employment and they lag the initial claims figures by one week.
The insured rate of unemployment slipped to 2.3%.
| Unemployment Insurance (000s) | 06/28/08 | 06/21/08 | Y/Y | 2007 | 2006 | 2005 |
|---|---|---|---|---|---|---|
| Initial Claims | 404 | 388 | 25.5% | 322 | 313 | 331 |
| Continuing Claims | -- | 3,116 | 21.9% | 2,552 | 2,459 | 2,662 |
by Tom Moeller July 3, 2008
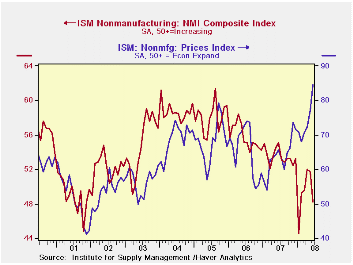
In June, the Composite Index for the non-manufacturing sector from the Institute for Supply Management fell to its lowest level since this past January. At 48.2, the index fell from 51.7. Consensus expectations had been for a higher reading of 51.0.
Beginning with the January 2008 Non-Manufacturing Report On Business®, a composite index is now calculated as an indicator of the overall economic condition for the non-manufacturing sector. It is a composite index based on the diffusion indexes for four of the indicators (business activity, new orders, employment and supplier deliveries) with equal weights. The latest report from the ISM can be found here.
The non-manufacturing business activity sub-index fell to 49.9 from 53.6 and so far in 2008 has averaged a break-even 49.9, down from 56.0 during all of last year. Since the series' inception in 1997 there has been a 48% correlation between the level of the business activity index for the non-manufacturing sector and the Q/Q change in real GDP for the services and the construction sectors.
The new orders sub-index fell hard to 48.6 from 53.6 in May. The employment index fell even harder to 43.8, a historic low for this series. Since the series' inception in 1997 there has been a 56% correlation between the level of the ISM non-manufacturing employment index and the m/m change in payroll employment in the service-producing plus the construction industries.
Pricing power surged to a historic high for this series. Since inception ten years ago, there has been a 60% correlation between the price index and the q/q change in the GDP services chain price index.
ISM surveys more than 370 purchasing managers in more than 62 industries including construction, law firms, hospitals, government and retailers. The non-manufacturing survey dates back to July 1997.
Liquidity Crisis from the Federal Reserve Bank of Philadelphia can be found here.
| ISM Nonmanufacturing Survey | June | May | June '07 | 2007 | 2006 | 2005 |
|---|---|---|---|---|---|---|
| Composite Index | 48.2 | 51.7 | 55.1 | 53.5 | 55.7 | 58.0 |
| Prices Index | 84.5 | 77.0 | 65.6 | 63.8 | 65.3 | 68.0 |
by Robert Brusca July 3, 2008
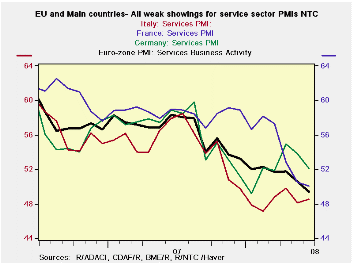
The service sector is eroding across Europe. France had
resisted deterioration for some time but in recent months the French
reading has dropped sharply. Spain and the UK have the weakest readings
since this index was instituted on a broad basis in May of 2000. France
and Italy are in the lower 10 percentile of their respective ranges.
Germany, at 53.3, is still showing expansion and is above the midpoint
of its range at a percentile standing of 56.9. For the whole of the
e-Zone the service sector standing is in the bottom 17 percentile of
its range.
All country indices were slipping from mid-2007 onward Germany
alone saw its service sector then find a bottom and rebound from early
2008 through April. But over the past two months Germany’s service
sector has been under pressure, despite is being the clear best
performer in the e-Zone.
The companion readings for consumer confidence show that the
performance of confidence across countries correlates well with the
performance of the service sector. Consumers in Spain and the UK are
the glummest and these countries have the weakest service sectors. The
French and Italian consumers are also glum but not as shell-shocked as
in the UK and Spain. Meanwhile, in Germany, consumer confidence, like
the service sector reading itself, stands above its range midpoint in
June.
The service sector is where the jobs are and therefore where
much of consumer income is generated. The performance of this sector is
important to the economy. The slippage in European services sector
performance is a bad sign for the future, especially on a day that the
ECB has chosen to hike its key lending rate by 25bp.
| NTC Services Indices for EU/EMU | |||||||
|---|---|---|---|---|---|---|---|
| Jun-08 | May-08 | Apr-08 | 3Mo | 6Mo | 12Mo | Percentile | |
| Euro-13 | 49.13 | 50.60 | 51.98 | 50.57 | 51.03 | 53.32 | 17.5% |
| Germany | 53.35 | 53.79 | 54.92 | 54.02 | 52.54 | 53.83 | 56.9% |
| France | 50.10 | 50.46 | 52.82 | 51.13 | 54.23 | 56.34 | 8.2% |
| Italy | 48.52 | 48.12 | 49.81 | 48.82 | 48.37 | 51.21 | 9.3% |
| Spain | 36.72 | 43.26 | 42.50 | 40.83 | 42.29 | 47.51 | 0.0% |
| Ireland | 41.94 | 43.89 | 45.19 | 43.67 | 46.55 | 50.84 | 0.0% |
| EU only | |||||||
| UK (CIPs) | 47.14 | 49.77 | 50.35 | 49.09 | 50.98 | 52.88 | 6.0% |
| EU Commission Indices for EU and EMU | |||||||
| EU Index | Jun-08 | May-08 | Apr-08 | 3Mo | 6Mo | 12Mo | Percentile |
| EU Services | 7 | 6 | 6 | -14.67 | -13.33 | -9.58 | 17.4% |
| EMU | Jun-08 | May-08 | Apr-08 | 3Mo | 6Mo | 12Mo | Percentile |
| Services | 9 | 8 | 7 | 8.00 | 9.33 | 13.25 | 39.4% |
| Cons Confidence | -17 | -15 | -12 | -14.67 | -13.33 | 5.64 | 17.4% |
| Consumer confidence by country | |||||||
| Germany-Consumer Confidence | -4 | -4 | 0 | -2.67 | -2.33 | 1.08 | 59.4% |
| France-Consumer Confidence | -22 | -18 | -15 | -18.33 | -16.50 | -11.33 | 21.2% |
| Italy-Consumer Confidence | -21 | -20 | -23 | -21.33 | -22.33 | -21.42 | 14.8% |
| Spain-Consumer Confidence | -38 | -31 | -25 | -31.33 | -25.67 | -20.25 | 0.0% |
| UK-Consumer Confidence | -20 | -15 | -13 | -16.00 | -12.33 | -7.75 | 0.0% |
| percentile is over range since May 2000 | |||||||

Tom Moeller
AuthorMore in Author Profile »Prior to joining Haver Analytics in 2000, Mr. Moeller worked as the Economist at Chancellor Capital Management from 1985 to 1999. There, he developed comprehensive economic forecasts and interpreted economic data for equity and fixed income portfolio managers. Also at Chancellor, Mr. Moeller worked as an equity analyst and was responsible for researching and rating companies in the economically sensitive automobile and housing industries for investment in Chancellor’s equity portfolio. Prior to joining Chancellor, Mr. Moeller was an Economist at Citibank from 1979 to 1984. He also analyzed pricing behavior in the metals industry for the Council on Wage and Price Stability in Washington, D.C. In 1999, Mr. Moeller received the award for most accurate forecast from the Forecasters' Club of New York. From 1990 to 1992 he was President of the New York Association for Business Economists. Mr. Moeller earned an M.B.A. in Finance from Fordham University, where he graduated in 1987. He holds a Bachelor of Arts in Economics from George Washington University.
More Economy in Brief


