 Global| Sep 05 2008
U.S. Payrolls Down Again, Jobless Rate Up Further
by:Tom Moeller
|in:Economy in Brief
Summary
Last month, nonfarm payrolls fell 84,000, according to the Bureau of Labor Statistics. The latest decline was slightly greater than expectations for a 75,000 drop but it was accompanied by downward revisions to prior months' data. [...]
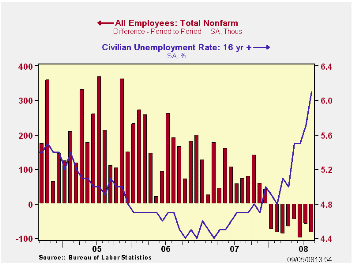
Last month, nonfarm payrolls fell 84,000, according to the Bureau of Labor Statistics. The latest decline was slightly greater than expectations for a 75,000 drop but it was accompanied by downward revisions to prior months' data. Payrolls have declined in each month of this year and it amounts to 605,000 jobs lost.
During the last three months payrolls fell at a 0.7% annual rate. That compared to a rate of decline in excess of 2.0% by the end of the last recession.
The unemployment rate jumped to 6.1% last month versus expectations for just a slight increase to 5.7%. That was the highest level since September of 2003.
Household sector employment fell 342,000 (-0.2% y/y) after a
72,000 worker decline during July. It was the sixth monthly decline
this year. The level of the unemployed rose 592,000 (31.4% y/y) after a
285,000 increase in July.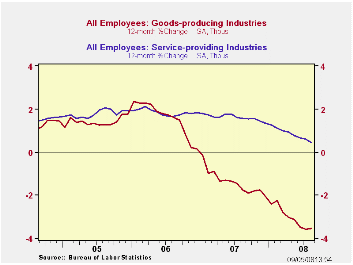
The labor force rose another 250,000 (1.3% y/y) last month and the labor force participation rate held at 66.1% for the third straight month. It was 66.0% during all of last year and 66.2% in 2006. The participation rate amongst adult men was 75.8%, about the same as averaged last year, and amongst adult women it was 61.1% versus 60.6% averaged during 2007.
The average duration of unemployment increased to 17.4 weeks and that was still up from 16.9 weeks averaged during the last two years. The number of those unemployed for more than 27 weeks rose by nearly one half versus one year ago.
From the establishment survey, hiring in the private service sector industries was notably weak. Jobs fell 44,000 but the 18,000 July decline was less than the 76,000 decline reported initially. Prior months' job losses also were revised shallower. Nevertheless, August was the seventh decline in the last eight months and the three-month rate of decline during that period was 0.3%.
A decline of 53,000 (-0.7% y/y) jobs was reported for the professional & business service industries. That was led by a 61,600 (-3.6% y/y) drop in hiring in the management & technical support services area. Temporary help services job also were quite weak as they fell 36,900 (-9.1% y/y). Retail sector jobs fell 19,900 and they're down at a 1.2% rate during the last three months. That rate of decline, however, remained less than the 3.0% rate of this past April. Motor vehicle & parts dealers employment led that drop with a 14,100 August decline and they're down at a 7.3% rate over the last three months. Jobs in the information sector fell 3,000 last month and at a 2.2% rate during the last three. Financial sector jobs fell 3,000 and at a 0.9% rate over the last three months.
These declines have been offset by 11.3% three-month growth in
the number of jobs in education and by 2.7% growth health care jobs.
The number of finance sector jobs fell 3,000 last month and they're
down at a 0.9% rate during the last three. Real estate sector jobs
slipped 1,400 and they have been falling at a moderate 0.6% annual rate
during the last three months which is an improvement from the 3% to 4%
rates of job loss late last year and early this year.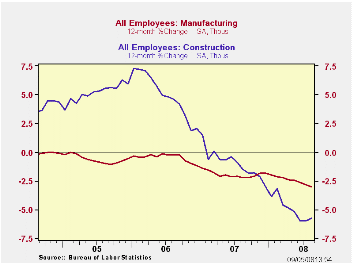
Factory sector jobs fell 61,000 which was the largest monthly decline since mid-2003. Payrolls were down at a 4.1% rate over the last three months though that was slower than the 10% rate of decline by the end of the 2001 recession. The motor vehicle & parts sector shed 39,000 (-12.9% y/y) jobs while jobs in the furniture industry fell 6,800 (-8.4% y/y).
Construction sector employment slipped just 8,000 last month after a little-revised 20,000 drop during July. They fell at a 4.2% annual rate during the last three months versus a 7.8% rate of decline as of June.
Government sector jobs continued to rise and they posted a
17,000 August increase. They've increased at a 0.6% rate during the
last three months. Federal government hiring rose at a 1.0% rate during
the last three months while state as well as local government hiring
rose at a 1.3% and a 0.2% rate, respectively. These rates of growth are
down from their recent peaks.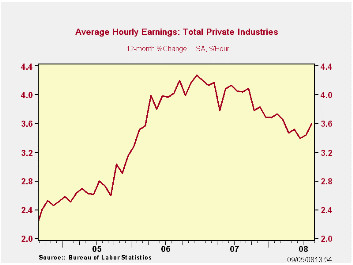
The one month diffusion index, which measures the breadth of job gain or loss (50 is the break-even level), improved to a near-break even 48.9%. The three-month index improved just slightly to 40.1% from the cycle low of 38.3% reached last month. The three-month figure for the factory sector was even weaker at 25.6%. That's up slightly from July but near the lowest since 2003.
Average hourly earnings increased 0.4%, the same as during as during an upwardly revised July. The three-month growth rate rose to 4.3%, its highest since early last year. Factory sector earnings fell 0.2% during August and rose at a 2.3% rate during the last three months, which was near the weakest since late last year. Private service sector earnings rose 0.4% and at an elevated 4.1% rate during the last three months.
China and India: Two Paths to Economic Power from the Federal Reserve Bank of Dallas can be found here.
| Employment: 000s | August | July | June | Y/Y | 2007 | 2006 | 2005 |
|---|---|---|---|---|---|---|---|
| Payroll Employment | -84 | -60 | -100 | -0.2% | 1.1% | 1.8% | 1.7% |
| Previous | -- | -51 | -51 | -- | 1.3% | 1.9% | 1.7% |
| Manufacturing | -61 | -38 | -44 | -3.0% | -1.9% | -0.5% | -0.6% |
| Construction | -8 | -20 | -50 | -5.7% | -1.0% | 4.9% | 5.2% |
| Average Weekly Hours | 33.7 | 33.7 | 33.7 | 33.8 (August '07) | 33.8 | 33.9 | 33.8 |
| Average Hourly Earnings | 0.4% | 0.4% | 0.3% | 3.6% | 4.0% | 3.9% | 2.7% |
| Unemployment Rate | 6.1% | 5.7% | 5.5% | 4.7% (August '07) | 4.6% | 4.6% | 5.1% |
by Robert Brusca September 5, 2008
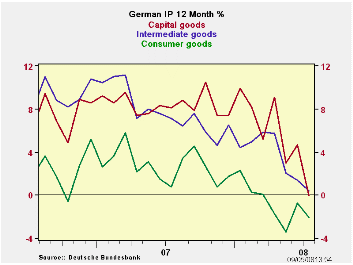
German statistics have been weakening and the weakness in orders reported yesterday was a shock to some. Today the process of being shocked continues with stark and unexpected weakness in German industrial output. Output is off for the second time in two months and by a severe 1.8% m/m. Yr/Yr the drop is -0.6%. MFG IP is off by 2% in the month. Sequential growth rates generally show that the weakness is still cumulating (construction and consumer spending are exceptions of sorts). In the new quarter to date (Q3) output is falling at a 13.3% annual rate, led by weakness in capital goods. While the drop in consumer goods output is the most severe on a Yr/Yr basis, the deceleration is the greatest for capital goods where output seems to stay so high for so long. This it turns out was mirage like Wiley Coyote standing on thin air waving to the Road Runner before gravity took hold. German capital goods output too seemed to defy the gravity and domestic weakness and the overly strong euro. But now that resilience is a thing of the past.
German authorities have tried to argue that the weakness is partly due to the start of the school year. But they hasten to add the trends are going to be lower. There should be fewer denials of encroaching weakness in Germany since the bottom fell out of orders and IP and that has happened just over the past two days.
Things change. And they did not elect either Obama or McCain.
Still the ECB has decided to tighten up its collateral acceptance parameters, and that action will impair liquidity in the Zone and at a time when economic weakness seems to be taking greater hold. In the US two speeches, one by Reserve Bank president Yellen, the other by Reserve Bank president Fisher, talked in less than glowing terms about the US economy. Fisher worries more about inflation prospects while Yellen reports that the next move by the Fed is more likely to be up than down but she reiterated Fed fallibility. Central bankers clearly are not plugged into the news that reveals accelerating weakness. Even the Bush Administration today took the opportunity to say that a new stimulus program was not needed.
While the economic data are worsening central banks seem to be taking the opportunity to let weaker growth drag inflation lower, rather than to move to offset the weakness. This is done by ignoring the weakening (Trichet), denying it (Germany, at least so far) or by making inflation the greater threat (Richard Fisher, and others).
| Total German IP | |||||||
|---|---|---|---|---|---|---|---|
| Saar exept m/m | Jul-08 | Jun-08 | May-08 | 3-mo | 6-mo | 12-mo | Quarter-to -Date |
| IP total | -1.8% | 0.1% | -1.8% | -13.3% | -8.0% | -0.6% | -13.3% |
| Consumer | -1.7% | 0.4% | -0.3% | -6.2% | -8.6% | -2.1% | -8.8% |
| Capital | -3.7% | 1.7% | -3.7% | -21.0% | -11.7% | -0.1% | -21.2% |
| Intermediate | -0.6% | -0.5% | -1.0% | -8.2% | -3.4% | 0.4% | -7.5% |
| Memo | |||||||
| Construction | -2.0% | -2.4% | 2.4% | -8.2% | -23.1% | -2.8% | -15.8% |
| MFG IP | -2.0% | 0.5% | -1.9% | -13.1% | -7.8% | -0.2% | -13.3% |
| MFG Orders | -1.7% | -2.6% | -1.3% | -20.0% | -15.2% | -4.1% | -20.7% |
OECD LEIs Continue to Sag as Japan Bucks Trend
by Robert Brusca September 5, 2008
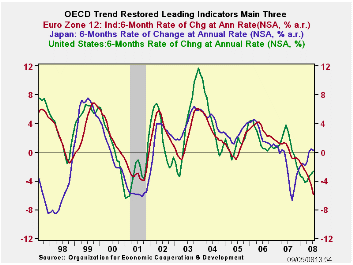
OECD Trends. The OECD trend-adjusted LEIs show clear ongoing declines. The OECD declines are getting progressively weaker for the entire area as well as for the OECD seven and for the OECD four. In the US, however, the OECD LEI is still declining but is dropping at a decelerating pace. The US LEI grew at the strongest pace one year ago and now its Yr/Yr pace is only in line with other OECD measures while its 3-month and 6-month pace is stronger than the other comparable OECD measures.
The OECD says. The OECD characterizes the G7 reading as consistent with a still-weakening climate. The OECD reports that the growth cycle outlook is for a slowdown in the OECD area, G7 area and Japan, while for the Euro area a strong slowdown is anticipated. "OECD composite leading indicators for July 2008 indicate a continued weakening outlook for all the major seven economies," the OECD said in its monthly release. "The latest data for major non-OECD member economies tentatively point to expansion in China, Brazil and Russia and a downturn in India," it said.
Selected Countries. Italy's composite indicator fell the sharpest of all the G7 countries, off 1.9 points on the month. The German and Canadian indicators dropped 1.5 points. Japan's indicator fell 0.5 point and the United States saw a 0.2 point fall.
Comparison with past US turning point. The US indicator is weak but did not get as weak as it did in or before the last economic downturn. It is now rising from its current cycle low. In Japan the index reach a spike low as weak as it was in the last recession but it did not stay impacted for as long as it did last time. The Japanese index is now rising. The index for the Euro-Zone economies is much weaker than it was at the time of the last US recession and it is still dropping at an increasing speed.
| OECD Trend-Restored Leading Indicators | ||||
|---|---|---|---|---|
| Growth progression-SAAR | ||||
| 3Mos | 6Mos | 12mos | Yr-Ago | |
| OECD | -4.6% | -3.6% | -3.3% | 1.9% |
| OECD 7 | -3.8% | -3.4% | -3.9% | 1.3% |
| OECD Europe | -9.0% | -6.8% | -4.5% | 1.1% |
| OECD Japan | 0.9% | -0.4% | -0.9% | -1.2% |
| OECD US | -0.5% | -1.8% | -3.8% | 2.5% |
| Six month readings at 6-month intervals: | ||||
| Recent six | 6Mo Ago | 12Mo Ago | 18MO Ago | |
| OECD | -3.6% | -2.9% | 1.7% | 2.2% |
| OECD 7 | -3.4% | -4.3% | 1.4% | 1.2% |
| OECD Europe | -6.8% | -2.2% | 0.6% | 1.5% |
| OECD Japan | -0.4% | -1.5% | -3.7% | 1.4% |
| OECD US | -1.8% | -5.7% | 3.5% | 1.5% |
| Slowdowns indicated by BOLD RED. | ||||

Tom Moeller
AuthorMore in Author Profile »Prior to joining Haver Analytics in 2000, Mr. Moeller worked as the Economist at Chancellor Capital Management from 1985 to 1999. There, he developed comprehensive economic forecasts and interpreted economic data for equity and fixed income portfolio managers. Also at Chancellor, Mr. Moeller worked as an equity analyst and was responsible for researching and rating companies in the economically sensitive automobile and housing industries for investment in Chancellor’s equity portfolio. Prior to joining Chancellor, Mr. Moeller was an Economist at Citibank from 1979 to 1984. He also analyzed pricing behavior in the metals industry for the Council on Wage and Price Stability in Washington, D.C. In 1999, Mr. Moeller received the award for most accurate forecast from the Forecasters' Club of New York. From 1990 to 1992 he was President of the New York Association for Business Economists. Mr. Moeller earned an M.B.A. in Finance from Fordham University, where he graduated in 1987. He holds a Bachelor of Arts in Economics from George Washington University.
More Economy in Brief


