 Global| May 02 2008
U.S. Payrolls Declined For Fourth Straight Month, Unemployment Slipped
by:Tom Moeller
|in:Economy in Brief
Summary
The Bureau of Labor Statistics reported that for the fourth consecutive month nonfarm payrolls fell. The 20,000 worker decline in April fell short of expectations for a decline of 78,000 and it followed a little revised 81,000 drop in [...]
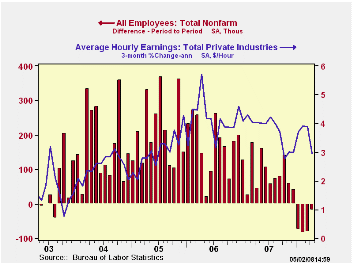
The Bureau of Labor Statistics reported that for the fourth consecutive month nonfarm payrolls fell. The 20,000 worker decline in April fell short of expectations for a decline of 78,000 and it followed a little revised 81,000 drop in March.
From the household sector survey, the unemployment rate slipped to 5.0% from the elevated 5.1% in March. Household employment recovered the declines during the prior two months and rose 362,000 (0.4% y/y). The labor force rose 173,000 (0.9% y/y). The labor force participation rate held steady at 66.0%, about the level of the last year while the number of persons who want a job rose slightly after two months of sharp decline.
The average duration of unemployment rose to 16.9 weeks from
16.2 in March. Those figures are down from the averages of the prior
several years.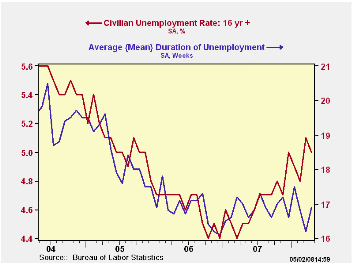
From the establishment survey, private nonfarm payrolls continued to indicate distress in the labor market. Private sector payrolls fell 29,000 last month, the fifth consecutive month of decline though it was less than the drops during the prior four months.
Factory sector jobs posted a 46,000 decline, which was about the same magnitude as declines during the prior three months. The three month rate of job loss of 4.0% was the fastest since 2003.
Construction sector employment declined 61,000 which was the largest decline since February '07. The three month growth rate deteriorated to -7.9%, its worst since 1991.
Hiring in the private service sector rose and the 81,000
increase recouped the negligible declines during the prior three
months. Health care & education jobs were strongest on a one
month basis. They rose 52,000 and the rate of increase has been steady
near 3.0%. A 39,000 increase in professional & business
services jobs accounted for much of the rest of last month's job gain
but the three month change in these jobs was still a negative 0.7%.
Temporary help services jobs, often a leading indicator of employment
growth, fell 9,300 and the three month change fell to -10.7% (AR).
Employment in finance rose 3,000 but it's still off 1.5% from the late
2006 peak. Real estate sector jobs fell 1,100 in April and were off
2.7% from the 2006 peak.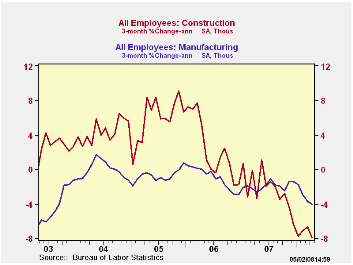
The one month diffusion index, which measures the breadth of job gain or loss (50 is the break even level), continued to indicate job loss and it stood at 45.4%. The three month index was even weaker at 42.9% which was near the lowest since 2003.
Average hourly earnings rose a negligible 0.1% after five consecutive months of 0.3% gain. Factory sector earnings fell 0.2% (+2.2% y/y) and that was the first monthly decline since 2004. Private service sector earnings rose 0.2% (3.7% y/y) after five consecutive months of 0.3% increase.
Today's announcement by the Federal Reserve that it, the European Central Bank and Swiss National Bank will expand liquidity measures can be found here.
| Employment: 000s | April | March | February | Y/Y | 2007 | 2006 | 2005 |
|---|---|---|---|---|---|---|---|
| Payroll Employment | -20 | -81 | -83 | 0.3% | 1.1% | 1.8% | 1.7% |
| Previous | -- | -80 | -76 | -- | 1.3% | 1.9% | 1.7% |
| Manufacturing | -46 | -48 | -47 | -2.3% | -1.9% | -0.5% | -0.6% |
| Construction | -61 | -46 | -44 | -5.0% | -1.0% | 4.9% | 5.2% |
| Average Weekly Hours | 33.7 | 33.8 | 33.7 | 33.8 (April '07) | 33.8 | 33.9 | 33.8 |
| Average Hourly Earnings | 0.1 | 0.3% | 0.3% | 3.4% | 4.0% | 3.9% | 2.7% |
| Unemployment Rate | 5.0 | 5.1% | 4.8% | 4.6% (April '07) | 4.6% | 4.6% | 5.1% |
by Tom Moeller May 2, 2008
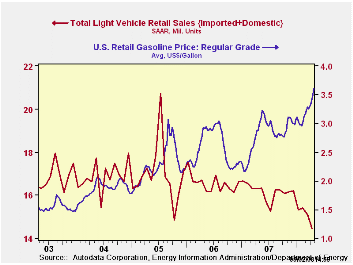
U.S. sales of light vehicles during April dropped another 4.8% m/m to a 14.39M unit annual selling rate, according to the Autodata Corporation. So far this year vehicle sales have fallen 11.1% while, since December, gasoline prices have risen 20.9%.
Higher gas prices have weighed heaviest on sales of
domestically made light trucks. They are relatively fuel
inefficient and April sales fell 8.5% m/m. That brought the decline
this year to 17.5%. In addition, sales of U.S. made cars fell 2.3% in
April and they are down 9.4% in 2008. Overall, sales of domestically
made light vehicles in April were at the lowest level since 1992.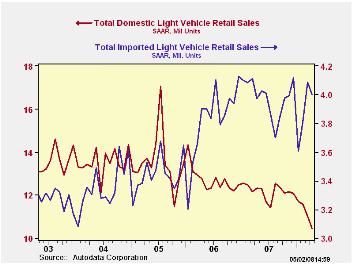
Sales of imported light vehicles fell a relatively moderate 2.1% m/m 4.00M units after a 7.4% March increase. Despite the April decline, the latest level of imported vehicle sales remained near the record. Sales of imported autos fell just 0.7% after the 11.5% surge in March. So far this year sales of imported cars rose 1.6%. Showing that sales of imported light trucks weren't immune to the softening of overall consumer spending, they fell last month by 4.6% and the decline lowered sales so far this year by 10.5%.
Import's share of the U.S. light vehicle market rose to another record level of 27.8%. (Imported vehicles are those produced outside the U.S. and does not include vehicles with the nameplate of a foreign manufacturer produced within the U.S.) Imports' share of the U.S. car market rose to 35.9% and the share of the light truck market was 19.3%; both records and more than double the shares ten years ago.
| Light Vehicle Sales (SAAR, Mil. Units) | April | March | Y/Y | 2007 | 2006 | 2005 |
|---|---|---|---|---|---|---|
| Total | 14.39 | 15.11 | -11.7% | 16.18 | 16.55 | 16.96 |
| Autos | 7.38 | 7.51 | 0.2% | 7.58 | 7.77 | 7.65 |
| Domestic | 4.73 | 4.84 | -3.1% | 5.07 | 5.31 | 5.40 |
| Imported | 2.65 | 2.67 | 6.7% | 2.51 | 2.45 | 2.25 |
| Light Trucks | 7.02 | 7.61 | -21.4% | 8.60 | 8.78 | 9.32 |
| Domestic | 5.67 | 6.19 | -23.9% | 7.12 | 7.42 | 8.12 |
| Imported | 1.35 | 1.42 | -9.0% | 1.48 | 1.37 | 1.20 |
by Robert Brusca May 2, 2008
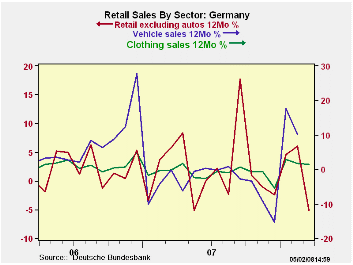
The original weakness in German ex-auto retail sales in
February had already been revised up, leaving February in a small
decline. Now March sales are flat. The strength in the quarter stems
from the surge back in January. Real retail sales are up at a 4.9%
annual rate in the quarter. Nominal sales are up by an eye popping
8.1%. But all of the quarter’s gains stem from a surge in sales in
January – a surge that still seems in the process of being unwound.
While recent German surveys of consumer sentiment have been upbeat,
surveys of retailers have not. It appears that real retail sales
ex-autos are in a position to boost Q1 GDP but it does not seem that
this is any sort of a watershed event.
| German Real and Nominal Retail Sales | ||||||||
|---|---|---|---|---|---|---|---|---|
| Nominal | Mar-08 | Feb-08 | Jan-08 | 3-MO | 6-MO | 12-MO | YrAgo | QTR Saar |
| Retail excl Auto | 0.0% | -0.2% | 2.3% | 8.8% | 2.1% | 1.5% | -0.1% | 8.1% |
| Food Beverage & Tobacco | 1.1% | -0.8% | 3.1% | 14.3% | 0.4% | 0.5% | 0.8% | 2.9% |
| Clothing footwear | -8.7% | 4.5% | 1.7% | -11.6% | -20.6% | -5.1% | 5.8% | 7.8% |
| Real | ||||||||
| Retail excl Auto | -0.1% | -0.7% | 1.9% | 4.5% | -1.2% | -1.2% | -0.7% | 4.9% |
by Robert Brusca May 2, 2008
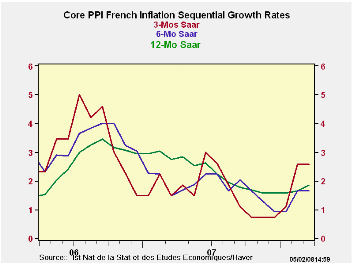
French producer prices again are showing over-the-top
inflation. The three-month overall rate is a 4.2% pace but that
represents some deceleration from 6.6% over six months and it is below
the 5.5% Yr/Yr rate. Still, inflation is up sharply from its year ago
annual rate of 2.1%. And, in the quarter-to-date the overall PPI rate
is still up at a 6% annual rate. The chart shows the halting roller
coaster that French PPI inflation has been riding.
Consumer prices at the producer level have stayed subdued
throughout, partly because consumer demand has been slack. Intermediate
prices are running up strongly with all the increases in energy metals
and other commodity prices. Investment goods, which have been in the
booming sector in Europe, have generally kept price tends in check. But
investment goods prices have accelerated slightly over three-months and
at 1.4% are moderate. Core PPI inflation has reversed a declining trend
and accelerated to 2.6% over three-months. At 1.8%, its Yr/Yr pace is
still under the overall inflation ceiling desired by the ECB- a ceiling
that formally refers only to the HICP but is applicable up and down the
inflation transmission line.
| France PPI | ||||||||
|---|---|---|---|---|---|---|---|---|
| m/m | Saar | |||||||
| France | Mar-08 | Feb-08 | Jan-08 | 3-Mo | 6-Mo | Yr/Yr | Y/Y Yr Ago | Qtr-2-Date |
| Total | 0.3% | 0.3% | 0.5% | 4.2% | 6.6% | 5.2% | 2.1% | 6.0% |
| Consumer | 0.2% | 0.0% | -0.3% | -0.4% | -0.2% | 0.4% | -0.3% | -1.2% |
| Intermediate | 0.3% | 0.7% | 0.5% | 6.0% | 2.9% | 3.2% | 4.7% | 4.7% |
| Investment | -0.1% | 0.1% | 0.4% | 1.5% | 1.1% | 1.2% | 2.6% | 1.5% |
| PPI excl Food and Energy | 0.1% | 0.4% | 0.2% | 2.6% | 1.6% | 1.8% | 2.7% | 2.1% |
by Robert Brusca May 2, 2008
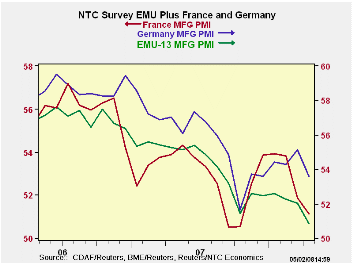
The NTC MFG indices fell on broad front in April. Their
declines were steeper than they have been. Still only Germany, Greece
and the Netherlands are in the top half of their respective percentile
ranges. The EMU economy as a whole is in the lower portion of its range
of values since March of 2000. Italy, Spain and Ireland are showing
extreme weakness. Still half of the EMU area’s MFG PMIs are showing
expansion and are above the neutral 50 reading; the UK is another. EMU
is looking vulnerable to weakness. EMU and its indices peaked in mid
2006. They cycled to a low in September of 2007, rebounded through
early 2008 before taking a new leg down. The slide in Europe on the
back of the rising euro makes sense. We still do not have much idea why
Europe broke out of its declining phase from mid to late 2007 when the
Euro was still strong. But its return to weakness makes sense.
| NTC MFG Indices | |||||||
|---|---|---|---|---|---|---|---|
| Apr-08 | Mar-08 | Feb-08 | 3Mo | 6Mo | 12Mo | Percentile | |
| Euro-13 | 50.74 | 52.03 | 52.34 | 51.70 | 52.21 | 53.15 | 44.5% |
| Germany | 53.62 | 55.14 | 54.28 | 54.35 | 54.13 | 54.79 | 61.4% |
| France | 51.12 | 51.88 | 53.81 | 52.27 | 52.86 | 52.68 | 39.9% |
| Italy | 48.24 | 49.41 | 50.64 | 49.43 | 50.20 | 51.74 | 29.5% |
| Spain | 45.19 | 46.42 | 46.72 | 46.11 | 48.06 | 50.21 | 12.4% |
| Austria | 49.83 | 53.39 | 52.36 | 51.86 | 52.98 | 53.49 | 41.9% |
| Greece | 54.38 | 52.73 | 52.35 | 53.15 | 52.98 | 53.50 | 57.9% |
| Ireland | 44.69 | 46.01 | 49.78 | 46.83 | 48.12 | 50.73 | 0.0% |
| Netherlands | 51.45 | 53.15 | 51.91 | 52.17 | 53.08 | 55.03 | 51.6% |
| EU | |||||||
| UK | 50.96 | 51.25 | 51.24 | 51.15 | 51.73 | 53.18 | 50.6% |
| percentile is over range since March 2000 | |||||||

Tom Moeller
AuthorMore in Author Profile »Prior to joining Haver Analytics in 2000, Mr. Moeller worked as the Economist at Chancellor Capital Management from 1985 to 1999. There, he developed comprehensive economic forecasts and interpreted economic data for equity and fixed income portfolio managers. Also at Chancellor, Mr. Moeller worked as an equity analyst and was responsible for researching and rating companies in the economically sensitive automobile and housing industries for investment in Chancellor’s equity portfolio. Prior to joining Chancellor, Mr. Moeller was an Economist at Citibank from 1979 to 1984. He also analyzed pricing behavior in the metals industry for the Council on Wage and Price Stability in Washington, D.C. In 1999, Mr. Moeller received the award for most accurate forecast from the Forecasters' Club of New York. From 1990 to 1992 he was President of the New York Association for Business Economists. Mr. Moeller earned an M.B.A. in Finance from Fordham University, where he graduated in 1987. He holds a Bachelor of Arts in Economics from George Washington University.
More Economy in Brief


