 Global| Oct 02 2009
U.S. Payrolls Decline Again WhileJobless Rate Increases
by:Tom Moeller
|in:Economy in Brief
Summary
For September, the employment figures from the Bureau of Labor Statistics were uniformly weak. Payrolls fell a more-than-expected 263,000. Hours worked fell again. The unemployment rate rose to 9.8%, the highest since 1983. All in [...]
 For September, the employment figures from the Bureau of Labor
Statistics were uniformly weak. Payrolls fell a more-than-expected
263,000. Hours worked fell again. The unemployment rate rose to 9.8%,
the highest since 1983. All in all, they suggest that the rate of
decline in the job market has slowed, but an upturn still is not
evident.
For September, the employment figures from the Bureau of Labor
Statistics were uniformly weak. Payrolls fell a more-than-expected
263,000. Hours worked fell again. The unemployment rate rose to 9.8%,
the highest since 1983. All in all, they suggest that the rate of
decline in the job market has slowed, but an upturn still is not
evident.
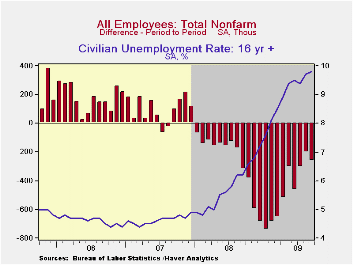
Nonfarm payrolls fell 263,000 during September. That exceeded expectations for a 180,000 decline and while the August shortfall was lessened, July's was deepened. So far during this recession employment has fallen by a total of 7.2 million, by far the record for a 21-month period. In percentage terms, jobs are down 5.2% since the 2007 peak, also a record. If there is good news, it's that the decline in payroll declines moderated to an average 256,000 over the last three months versus a peak rate of 701,000 this past winter.
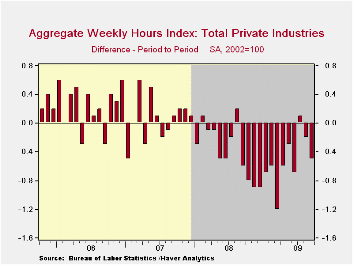
The length of the average workweek fell back to the cycle low of 33.0 hours. Combined with the decline in payrolls that was enough to pull 3Q aggregate hours worked (employment times hours) down at a 3.0% annual rate after a 7.8% decline during 2Q. Productivity needs to rise more than that if real GDP is going to rise as is widely expected.
 The increase in the unemployment rate to 9.8% from 9.7% was
as-expected and it left the rate at the highest level since 1983. The
rate's cycle low of 4.4% occurred in October 2006. The official
unemployment rate pales, however, in comparison to the rate which
includes "marginally attached workers" and those who are working
part-time for economic reasons. It rose to 17.0%. Including
"discouraged workers" the unemployment rate stood at 10.2%.
The increase in the unemployment rate to 9.8% from 9.7% was
as-expected and it left the rate at the highest level since 1983. The
rate's cycle low of 4.4% occurred in October 2006. The official
unemployment rate pales, however, in comparison to the rate which
includes "marginally attached workers" and those who are working
part-time for economic reasons. It rose to 17.0%. Including
"discouraged workers" the unemployment rate stood at 10.2%.
The increase in the overall jobless rate was due to a 785,000 (-4.3% y/y) decline in household employment. That was shallower than the worst monthly declines of this past winter but worse than those of the last several months. It was accompanied by a sharp 571,000 (-0.4% y/y) decline in the labor force reflecting the discouraged workers. Also from the household survey, the median duration of unemployment jumped m/m to 17.3 weeks, just below this cycle's high reached in June. The ranks of the long-term unemployed rose to 5.438 million (166.4% y/y), an historic high. By educational attainment, those with a high school diploma but no college saw employment fall 5.2% y/y while those with a bachelor's degree or higher experienced a 0.7% decline.
 From the payroll survey, the quickening in the rate of job
loss last month was due to a faster 94,000 (-3.1% y/y) decline in
private service payrolls. Declines were broad-based notably in retail
trade, educational services, and professional & tech services.
Also, in the government sector employment fell a sharp 53,000 (-0.6%
y/y as budgets shrank with lower tax revenues. The number of local
gov't jobs led the decline with a 37,000 (-0.9% y/y) drop. Jobs with
the federal government fell 5,000 (+1.9% y/y) for the third decline in
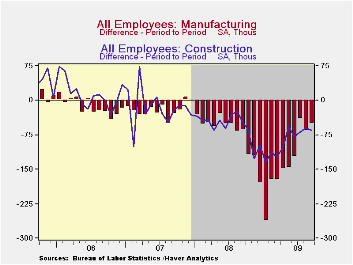
the last four months. Manufacturing sector jobs fell 51,000 last month
after a 66,000 July decline. These shortfalls compare to average
monthly declines of 131,000 this year. Construction jobs fell 64,000
and they fell an average 89,000 each month this year.
From the payroll survey, the quickening in the rate of job
loss last month was due to a faster 94,000 (-3.1% y/y) decline in
private service payrolls. Declines were broad-based notably in retail
trade, educational services, and professional & tech services.
Also, in the government sector employment fell a sharp 53,000 (-0.6%
y/y as budgets shrank with lower tax revenues. The number of local
gov't jobs led the decline with a 37,000 (-0.9% y/y) drop. Jobs with
the federal government fell 5,000 (+1.9% y/y) for the third decline in
the last four months. Manufacturing sector jobs fell 51,000 last month
after a 66,000 July decline. These shortfalls compare to average
monthly declines of 131,000 this year. Construction jobs fell 64,000
and they fell an average 89,000 each month this year.
The breath of the decline in payroll employment extended to 14.9% of industries during the last twelve months while it rose to 28.0% during the last three months.
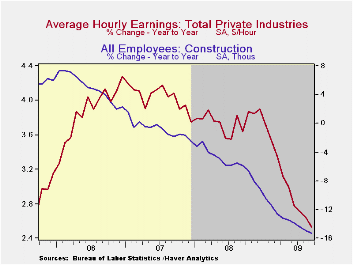
Average hourly earnings ticked up just 0.1% during September. That pulled the y/y gain down to 2.5% which was its weakest since late-2004, down from 4.2% reached during 2007. Earnings in the factory sector actually have improved recently and rose 0.7% (2.8% y/y). Growth in durable sector's earnings rose 0.7% and the y/y rate quickened to 3.7%. Earnings in the private service sector rose just 0.5% (2.7% y/y) while construction sector earnings fell 1.4% y/y.
 The Labor Department offered a preliminary look at the
benchmark revision to the payroll data to be issued in February, 2010.
The revised data show that the level of payroll employment as of March
of 2009 will be lowered by 824,000, or 0.6%, from current published
numbers.
The Labor Department offered a preliminary look at the
benchmark revision to the payroll data to be issued in February, 2010.
The revised data show that the level of payroll employment as of March
of 2009 will be lowered by 824,000, or 0.6%, from current published
numbers.
The figures referenced above are available in Haver's USECON database. Additional detail can be found in the LABOR and in the EMPL databases.
Fed Policy in the Financial Crisis: Arresting the Adverse Feedback Loop from the Federal Reserve Bank of Dallas is available here.
| Employment: 000s | September | August | July | Y/Y | 2008 | 2007 | 2006 |
|---|---|---|---|---|---|---|---|
| Payroll Employment | -263 | -201 | -304 | -4.2% | -0.4% | 1.1% | 1.8% |
| Previous | -- | -216 | -276 | -- | -- | -- | -- |
| Manufacturing | -51 | -66 | -41 | -12.0% | -3.3% | -2.0% | -0.5% |
| Construction | -64 | -60 | -69 | -15.3% | -5.5% | -0.8% | 4.9% |
| Service Producing | -147 | -69 | -188 | -2.6% | 0.2% | 1.6% | 1.8% |
| Average Weekly Hours | 33.0 | 33.1 | 33.1 | 33.6 (Sept. '08) | 33.6 | 33.8 | 33.9 |
| Average Hourly Earnings | 0.1% | 0.4% | 0.3% | 2.5% | 3.8% | 4.0% | 3.9% |
| Unemployment Rate | 9.8% | 9.7% | 9.4% | 6.2% (Sept. '08) | 5.8% | 4.6% | 4.6% |
U.S. Vehicle Sales Payback August Strength
by Tom Moeller October 2, 2009
Payback time came last month for vehicle sales that were pulled forward by price discounts. U.S. unit sales of light vehicles during September fell sharply with the end of the "Cash-for-Clunkers" sales program. Sales last month fell 34.6% m/m to 9.22M units according to the Autodata Corporation. (Seasonal adjustment of the figures is provided by the U.S. Bureau of Economic Analysis). September sales were weaker than the expected 9.6M sales rate and were at their lowest since February.
Sales of domestically made vehicles fell by more than one-third from August to 6.62M units and they were down 29.7% y/y. Sales of fuel efficient cars fell nearly 40% m/m while light truck sales posted a 29% m/m decline that left them down one-third versus last September. Year-to-date, sales of domestic vehicles overall were down 13.1% following last year's 35.8% drop from December-to-December.
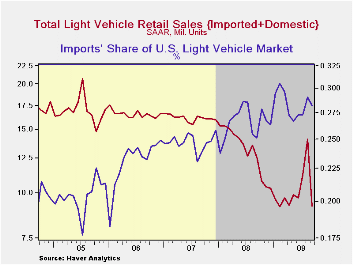
Imported light vehicles similarly fell with the end of the government's sales program. A 36.5% m/m decline to 2.60 units more than reversed the August increase. Sales of imported autos fell a hard 36.3% while sales of imported light trucks also fell by more than one-third m/m. Year-to-date, sales of imported vehicles were slightly below last year's average.
Overall, import's share of the U.S. light
vehicle market slipped to 28.2% last month from 29.0% in August. It
reached 26.5% during all of last year. (Imported vehicles are those
produced outside the United States.) Imports' share of the U.S. car
market totaled 35.3%, versus 34.3% last year while the share of the
light truck market was 19.7%, up slightly from 18.3% last year.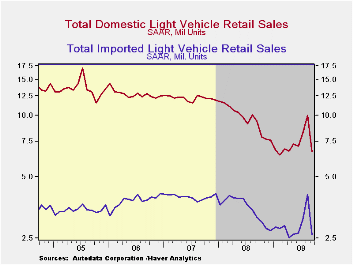
The U.S. vehicle sales figures can be found in Haver's USECON database.
Regulatory reform is yesterday's House testimony by Fed Chairman Ben S. Bernanke and it can be found here.
| Light Vehicle Sales (SAAR, Mil. Units) | September | August | July | Sept. Y/Y | 2008 | 2007 | 2006 |
|---|---|---|---|---|---|---|---|
| Total | 9.22 | 14.09 | 11.24 | -26.7% | 13.17 | 16.16 | 16.54 |
| Autos | 5.02 | 8.05 | 6.20 | -20.3 | 6.71 | 7.58 | 7.77 |
| Domestic | 3.25 | 5.26 | 4.11 | -23.8 | 4.42 | 5.07 | 5.31 |
| Imported | 1.77 | 2.78 | 2.09 | -12.9 | 2.29 | 2.52 | 2.45 |
| Light Trucks | 4.20 | 6.05 | 5.04 | -33.0 | 6.47 | 8.60 | 8.78 |
| Domestic | 3.37 | 4.75 | 4.06 | -34.6 | 5.29 | 7.10 | 7.42 |
| Imported | 0.83 | 1.31 | 0.98 | -26.1 | 1.18 | 1.47 | 1.37 |
Challenger Layoffs Fall Further To Cycle Low
by Tom Moeller October 2, 2009
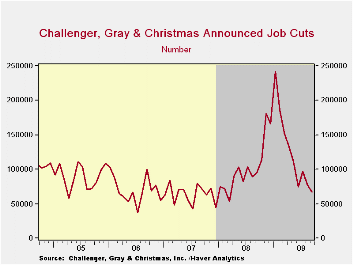
The outplacement firm of Challenger, Grey & Christmas indicated that job cut announcements fell last month to the current cycle low. They dropped to 66,404, compared to a high of 241,748 cuts in February of this year.
During the last ten years there has been a 67% (inverse) correlation between the three month moving average of announced job cuts and the three month change payroll employment. Job cut announcements differ from layoffs. Many are achieved through attrition, early retirement or just never occur.
In addition to fewer layoffs, hiring plans have picked up and were more than double last year's level. There have been strong increase in services, electronics and entertainment/leisure industries.
The Challenger figures are available in Haver's SURVEYS database.
| Challenger, Gray & Christmas | September | August | Y/Y | 2008 | 2007 | 2006 |
|---|---|---|---|---|---|---|
| Announced Job Cuts | 66,404 | 76,456 | -30.2% | 1,223,993 | 768,264 | 839,822 |
| Announced Hiring Plans | 25,047 | 13,100 | 162.6 | 118,600 | 365,753 | 276,525 |
PPI Points Way Higher for Euro Area Inflation
by Robert Brusca October 2, 2009
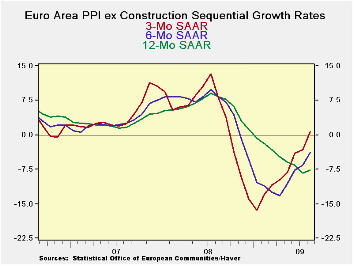
August’s EMU PPI excluding construction rose by 0.7% following
a drop of 0.9% in July. Still the three-month growth rate (annualized)
is now positive at 0.7% the six month growth rate is at -3.9% and the
12-month growth rate is at -7.6%. Inflation is gaining a toe hold again
in EMU at the producer price level. The ECB ahs a ceiling arrangement
for the HICP only (harmonized index of consumer inflation).
Even so, inflation does not appear to be cooking in any sense
of the word. For consumer goods, prices were still flat in August and,
at -0.3%, the three month growth rate for consumer goods is still close
to its six month annualized pace at -0.6%. There is no pressure there.
Capital goods prices continued to fall in August dropping by 0.1%. Over
three months, capital goods prices are falling by 0.8%; that is a
slight but only a slight improvement from dropping by 1.4% at an annual
rate over six months. There is not much inflation pressure from capital
goods prices either.
Virtually all the inflation pressure in the PPI is coming from
industrial supplies or intermediate goods. Intermediate goods prices
rose by 0.4% in August. They are also up at a 1.1% annual rate over
three months and down at an annual rate of 3.6% over six months.
Across EMU countries the headline PPI rose in all of the
largest of them. Ex food and energy prices rose in Germany and in
France as well. For all these price measures, the August rise is
balanced by a drop in July.
Still the bottom line is that prices are on the move again.
While it does not look like the pressures are very widespread across
commodity classifications or very intense, the pressure seems quite
real and widespread cross the larger EMU nations.
| Euro Area and UK PPI Trends | ||||||
|---|---|---|---|---|---|---|
| M/M | Saar | |||||
| Euro Area | Aug-09 | Jul-09 | 3-Mo | 6-MO | Yr/Yr | Y/Y Yr Ago |
| Total excl Constructions | 0.7% | -0.9% | 0.7% | -3.9% | -7.6% | 8.3% |
| Capital Goods | -0.1% | -0.1% | -0.8% | -1.4% | -0.2% | 2.4% |
| Consumer Goods | 0.0% | 0.0% | -0.3% | -0.6% | -2.6% | 4.2% |
| Intermediate & Cap Goods | 0.4% | -0.1% | 1.1% | -3.6% | -7.4% | 5.4% |
| MFG | 1.0% | -0.5% | 4.1% | -0.7% | -7.1% | 6.8% |
| Germany | 0.5% | -1.6% | -6.8% | -9.4% | -7.6% | 8.1% |
| Germany excl Energy | 0.3% | -0.2% | 0.0% | -1.9% | -3.3% | 3.2% |
| France | 0.7% | -0.4% | 4.0% | -2.9% | -8.4% | 7.7% |
| France excl Food & Energy | 0.1% | -0.3% | -1.1% | -2.6% | -3.6% | 3.4% |
| Italy | 0.9% | -0.9% | 1.1% | -2.8% | -7.8% | 8.1% |
| UK | 2.5% | -1.7% | 6.2% | 1.0% | -6.5% | 21.9% |
| Euro Area Harmonized PPI ex construction | ||||||
| The EA 13 countries are Austria, Belgium, Finland, France, Germany, Greece, Ireland, Italy, Luxembourg, the Netherlands, Portugal, Slovenia | ||||||

Tom Moeller
AuthorMore in Author Profile »Prior to joining Haver Analytics in 2000, Mr. Moeller worked as the Economist at Chancellor Capital Management from 1985 to 1999. There, he developed comprehensive economic forecasts and interpreted economic data for equity and fixed income portfolio managers. Also at Chancellor, Mr. Moeller worked as an equity analyst and was responsible for researching and rating companies in the economically sensitive automobile and housing industries for investment in Chancellor’s equity portfolio. Prior to joining Chancellor, Mr. Moeller was an Economist at Citibank from 1979 to 1984. He also analyzed pricing behavior in the metals industry for the Council on Wage and Price Stability in Washington, D.C. In 1999, Mr. Moeller received the award for most accurate forecast from the Forecasters' Club of New York. From 1990 to 1992 he was President of the New York Association for Business Economists. Mr. Moeller earned an M.B.A. in Finance from Fordham University, where he graduated in 1987. He holds a Bachelor of Arts in Economics from George Washington University.
More Economy in Brief


