 Global| Mar 10 2006
U.S. Payrolls Advance
by:Tom Moeller
|in:Economy in Brief
Summary
Non-farm payrolls rose 243,000 last month following a downwardly revised 170,000 increase during January that was initially reported at 193,000. Consensus expectations had been for a 210,000 increase during February. From the [...]
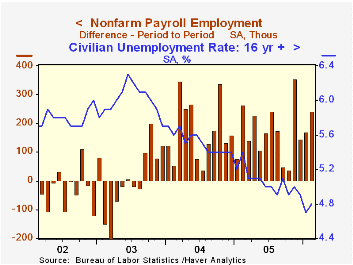
Non-farm payrolls rose 243,000 last month following a downwardly revised 170,000 increase during January that was initially reported at 193,000. Consensus expectations had been for a 210,000 increase during February.
From the household survey the unemployment rate rose modestly to 4.8% but remained near the five year low. Employment rose 183,000 (2.1% y/y) while the labor force rose 335,000 (1.5% y/y). An unchanged 4.7% unemployment rate had been the Consensus expectation for February.
Service producing payrolls surged 198,000 (1.5% y/y), the strongest gain since November, goosed by a 38,000 (0.7% y/y) rise in government employment which more than reversed the decline during January.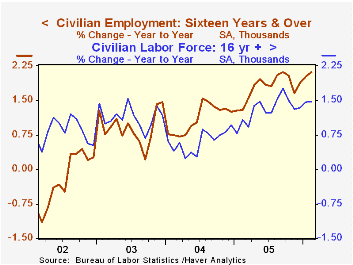
Jobs in private service-producing industries rose 160,000 (1.8% y/y) on the strength of a 22,000 (2.1% y/y) gain in financial activities employment and a 39,000 (2.8% y/y) worker rise in professional & business services. Job gains in education & health also rose a strong 47,000 (2.4% y/y) while jobs in leisure & hospitality jobs rose 25,000 (1.9% y/y).
Warm weather continued to bolster construction employment which added 41,000 (4.8% y/y) to an upwardly revised 55,000 gain during January.
Factory sector payrolls slipped during February. The 1,000 worker decline (-0.3% y/y) was the first drop since September and reflected fewer managers. The number of production workers on the job rose 3,000 (1.4% y/y) with durable goods industries adding 2,000 (2.3% y/y). Employment in the motor vehicles & parts industries fell 10,600 (-2.5% y/y). The breadth of gain in factory payrolls over the last three months slipped to a still firm 56.0%.
Average hourly earnings rose an expected 0.3% though factory sector earnings fell 0.1% (+1.8% y/y) and private service producing wages rose 0.4% (3.9% y/y).
Business employment dynamics: tabulations by employer size from the Bureau of Labor Statistics can be found here.
| Employment | Feb | Jan | Y/Y | 2005 | 2004 | 2003 |
|---|---|---|---|---|---|---|
| Payroll Employment | 243,000 | 170,000 | 1.5% | 1.5% | 1.1% | -0.3% |
| Manufacturing | -1,000 | 7,000 | -0.3% | -0.6% | -1.3% | -4.9% |
| Average Weekly Hours | 33.7 | 33.8 | 33.7 (Feb '05) | 33.8 | 33.7 | 33.7 |
| Average Hourly Earnings | 0.3% | 0.4% | 3.5% | 2.8% | 2.1% | 2.7% |
| Unemployment Rate | 4.8% | 4.7% | 5.4% (Feb '05) | 5.1% | 5.5% | 6.0% |

Tom Moeller
AuthorMore in Author Profile »Prior to joining Haver Analytics in 2000, Mr. Moeller worked as the Economist at Chancellor Capital Management from 1985 to 1999. There, he developed comprehensive economic forecasts and interpreted economic data for equity and fixed income portfolio managers. Also at Chancellor, Mr. Moeller worked as an equity analyst and was responsible for researching and rating companies in the economically sensitive automobile and housing industries for investment in Chancellor’s equity portfolio. Prior to joining Chancellor, Mr. Moeller was an Economist at Citibank from 1979 to 1984. He also analyzed pricing behavior in the metals industry for the Council on Wage and Price Stability in Washington, D.C. In 1999, Mr. Moeller received the award for most accurate forecast from the Forecasters' Club of New York. From 1990 to 1992 he was President of the New York Association for Business Economists. Mr. Moeller earned an M.B.A. in Finance from Fordham University, where he graduated in 1987. He holds a Bachelor of Arts in Economics from George Washington University.
More Economy in Brief


