 Global| Jun 05 2009
U.S. Payroll Losses Slow AsUnemployment Rate Jumps
by:Tom Moeller
|in:Economy in Brief
Summary
The May figures from the Bureau of Labor Statistics indicated moderation in the rate of job loss, though the labor market remains quite weak. Nonfarm payrolls fell 345,000 last month and that was the smallest monthly decline since [...]
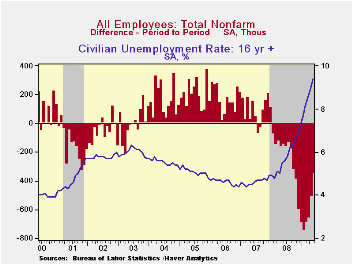
The May figures from the Bureau of Labor Statistics indicated moderation in the rate of job loss, though the labor market remains quite weak. Nonfarm payrolls fell 345,000 last month and that was the smallest monthly decline since last September. The drop certainly compared favorably to Consensus expectations for a 520,000 decline and declines in employment during the prior two months were revised shallower. During this recession so far employment has fallen a total of 6.1 million, the record for a 17-month period. In percentage terms, jobs are down 4.3% since the 2007 peak.
The unemployment rate continued to reflect the labor market's distress with a rise to 9.4%, the highest level since August of 1983. The cycle low in the rate occurred in October 2006 (4.4%). Pumping up the rate last month was a 437,000 (-3.7% y/y) decline in employment versus a 130,000 (0.4% y/y) rise in the labor force. These household sector figures additionally show that long-term unemployment rose further. The average duration of unemployment rose during May to a new record of 22.5 weeks from an average of 17.8 weeks during 2008.
 Also from the household survey was an indication that 5.9
million people want a job now but are not in the labor force. That
figure is up 21.8% from last May and near the highest since 1995. In
tandem, the labor force participation rate, i.e., the number of
eligible workers who are in the labor force stands at 65.9% versus the
2000 high of 67.1%.
Also from the household survey was an indication that 5.9
million people want a job now but are not in the labor force. That
figure is up 21.8% from last May and near the highest since 1995. In
tandem, the labor force participation rate, i.e., the number of
eligible workers who are in the labor force stands at 65.9% versus the
2000 high of 67.1%.
The latest data from the payroll survey give insight into real GDP growth last quarter. Combined with the lessened decline in employment is a slightly shorter length of the average workweek. Aggregate hours worked fell at a 6.9% annual rate versus an 8.9% 1Q drop. That drop was associated with a real GDP decline of 5.7%,. Therefore, the 2Q GDP rate of decline likely eased. During the last twenty years, there has been a 68% correlation between growth in hours worked and in real GDP.
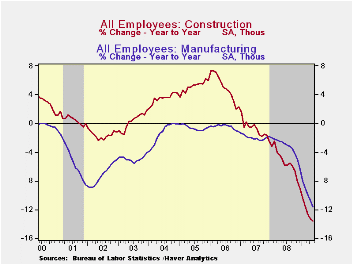
 The easing in the rate of job loss last month was due to
lessened declines in construction and in services jobs. After having
shed more than roughly 100,000 jobs during each of the prior six
months, the construction sector lost just 59,000 workers last month.
Service sector job loss moderated as well with a decline of 120,000.
That compares to declines between 196,000 and 399,000 since last
September. Losses eased sharply in the professional & business
services sector, in the retail trade area and in the financial sector.
In contrast, the rate of job loss in the factory sector has barely
changed. Though the latest decline is improved from a slash of 262,000
jobs during January, the latest drop of 156,000 is close to the average
monthly losses since October. In the government sector, 7,000 jobs were
shed after a 92,000 worker gain during April.
The easing in the rate of job loss last month was due to
lessened declines in construction and in services jobs. After having
shed more than roughly 100,000 jobs during each of the prior six
months, the construction sector lost just 59,000 workers last month.
Service sector job loss moderated as well with a decline of 120,000.
That compares to declines between 196,000 and 399,000 since last
September. Losses eased sharply in the professional & business
services sector, in the retail trade area and in the financial sector.
In contrast, the rate of job loss in the factory sector has barely
changed. Though the latest decline is improved from a slash of 262,000
jobs during January, the latest drop of 156,000 is close to the average
monthly losses since October. In the government sector, 7,000 jobs were
shed after a 92,000 worker gain during April.
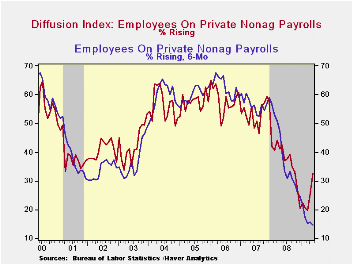
Overall, 32.7% of industries posted job gains last month, up from the March low of 19.6%. Over the last six months, however, just 14.6% posted job growth, a record low since 1990. In the factory sector just 12.0% posted job gains and only 6.0% did over the last six months.
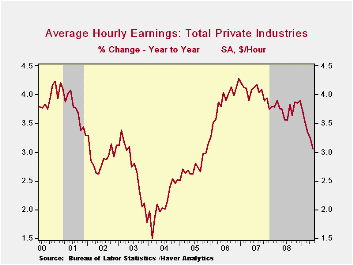
 The weakness in the job market has naturally lessened the
growth in workers' earning power. Average hourly earnings last month
inched up just 0.1%, the same as during April. These readings dropped
the year-to-year growth to 3.1%, the lowest since late 2005. However,
further slowing already has occurred as the three-month rate of growth
was just 1.7% (AR), its lowest since early-2004. Three-month growth in
factory sector earnings has dropped to 0.2% from a late-2008 rate of
5%. Growth in the nondurable sector's earnings has turned negative.
The weakness in the job market has naturally lessened the
growth in workers' earning power. Average hourly earnings last month
inched up just 0.1%, the same as during April. These readings dropped
the year-to-year growth to 3.1%, the lowest since late 2005. However,
further slowing already has occurred as the three-month rate of growth
was just 1.7% (AR), its lowest since early-2004. Three-month growth in
factory sector earnings has dropped to 0.2% from a late-2008 rate of
5%. Growth in the nondurable sector's earnings has turned negative.
The figures referenced above are available in Haver's USECON database. Additional detail can be found in the LABOR and in the EMPL databases.
| Employment: 000s | May | April | March | Y/Y | 2008 | 2007 | 2006 |
|---|---|---|---|---|---|---|---|
| Payroll Employment | -345 | -504 | -652 | -3.9% | -0.4% | 1.1% | 1.8% |
| Previous | -- | -539 | -699 | -- | -- | -- | -- |
| Manufacturing | -156 | -154 | -172 | -11.6% | -3.3% | -2.0% | -0.5% |
| Construction | -59 | -108 | -123 | -13.6% | -5.5% | -0.8% | 4.9% |
| Service Producing | -120 | -230 | -340 | -2.4% | 0.2% | 1.6% | 1.8% |
| Average Weekly Hours | 33.1 | 33.2 | 33.1 | 33.7 (May '08) | 33.6 | 33.8 | 33.9 |
| Average Hourly Earnings | 0.1% | 0.1% | 0.2% | 3.1% | 3.8% | 4.0% | 3.9% |
| Unemployment Rate | 9.4% | 8.9% | 8.5% | 5.5% (May '08) | 5.8% | 4.6% | 4.6% |
by Robert Brusca June 5, 2009
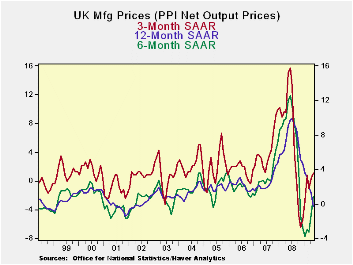
Shifting trends - The chart above is a
classic example of shifting trends. While the central banks tend to
focus on yr/yr prices viewing those changes are more ‘reliable,’ there
is no doubt that shorter measures give more up to data. The Yr/Yr UK
PPI has just fallen for the first time since 2002. Yet the real story
is that prices are moving up again. Over three-months and six months
seasonally adjusted prices are accelerating sharply –yes from lower
lows than the Yr/Yr series but the key signal here is the acceleration.
Prices are not falling any more that is the sky.
The Worm has Turned - Clearly the story
of falling prices told from the headline is yesterday’s news. Prices
are turning and the UK is on the cusp of change. It is the first
country in Europe to have its service sector survey say that activity
in that sector is expanding. Beware what you take as a barometer of
health I don’t think inflation is surging again but the worm has
turned. So don’t tail gate it.
| UK PPI _Ex Construction | |||||||
|---|---|---|---|---|---|---|---|
| %m/m | %-SAAR | ||||||
| May-09 | Apr-09 | Mar-09 | 3-mo | 6-mo | 12-mo | 12-moY-Ago | |
| MFG | 0.3% | 0.3% | -0.3% | 1.1% | 0.9% | -0.3% | 9.0% |
| Core | #N/A | -0.1% | 0.4% | #N/A | #N/A | #N/A | 2.3% |
| 1-MO Lagged Core | -- | -- | --- | 2.9% | 7.2% | 6.3% | 2.2% |
| Core: ex food beverages, tobacco & Petroleum | |||||||

Tom Moeller
AuthorMore in Author Profile »Prior to joining Haver Analytics in 2000, Mr. Moeller worked as the Economist at Chancellor Capital Management from 1985 to 1999. There, he developed comprehensive economic forecasts and interpreted economic data for equity and fixed income portfolio managers. Also at Chancellor, Mr. Moeller worked as an equity analyst and was responsible for researching and rating companies in the economically sensitive automobile and housing industries for investment in Chancellor’s equity portfolio. Prior to joining Chancellor, Mr. Moeller was an Economist at Citibank from 1979 to 1984. He also analyzed pricing behavior in the metals industry for the Council on Wage and Price Stability in Washington, D.C. In 1999, Mr. Moeller received the award for most accurate forecast from the Forecasters' Club of New York. From 1990 to 1992 he was President of the New York Association for Business Economists. Mr. Moeller earned an M.B.A. in Finance from Fordham University, where he graduated in 1987. He holds a Bachelor of Arts in Economics from George Washington University.
More Economy in Brief


