 Global| Aug 06 2004
U.S. Payroll Growth Weak, Slowdown Widespread
by:Tom Moeller
|in:Economy in Brief
Summary
Non-farm payrolls grew only 32,000 in July following a weak June gain of 78,000 (revised lower) and a strong May increase of 208,000 (also revised lower). Consensus expectations had been for a 240,000 job gain in July. From the [...]
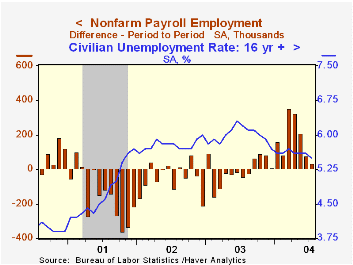
Non-farm payrolls grew only 32,000 in July following a weak June gain of 78,000 (revised lower) and a strong May increase of 208,000 (also revised lower). Consensus expectations had been for a 240,000 job gain in July.
From the separate household survey the unemployment rate dipped to 5.5% as a result of a huge 629,000 (1.5% y/y) rise in employment. The labor force also surged 577,000 (+0.8% y/y) as the labor force participation rate rose again to 66.2% versus 66.0% in June and four months at 65.9%.
The breadth of increase amongst private non-farm payrolls at 49.5% fell below 50% for the first month since last December. The three month diffusion index of hiring dropped to 61.0 versus a high of 74.5 in May.
Private service producing industries account for the slowdown in job growth. Growth of 14,000 in July (0.0% m/m, 1.5% y/y) compares to a 91,000 June increase and a three month average gain in May of 223,000. Job losses have been widespread amongst service industries: financial -23,000 m/m, +0.2% y/y; information -5,000 m/m, -0.6% y/y; retail -19,100 m/m, +0.9% y/y; trade & transportation -11,000 m/m, +1.1% y/y; temporary help services +4,900 m/m, 8.8% y/y.
Factory sector payrolls grew 10,000 (-0.3% y/y) in July. The breadth of factory sector hiring still indicates growth with readings of 54.2 and 51.2 in the last two months, but these numbers are down from figures above 60.0 in the prior three months. Hiring in transportation industries has fallen in the last four months.
Construction sector hiring grew just 4,000 (2.9% y/y) after a 3,000 June increase and gains that averaged 39,000 during the prior three months.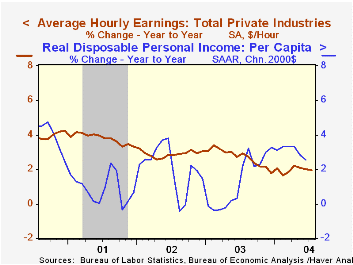
The index of aggregate hours worked (employment times hours worked) grew 0.3% and began the third quarter 0.2% above 2Q which rose 1.3% (AR) versus 1Q.
Average hourly earnings rose 0.3% (1.9% y/y).
The Federal Reserve Bank of San Francisco in a report titled "The Computer Evolution" here discusses the computer's effect on jobs and income.
| Employment | July | June | Y/Y | 2003 | 2002 | 2001 |
|---|---|---|---|---|---|---|
| Payroll Employment | 32,000 | 78,000 | 1.1% | -0.3% | -1.1% | 0.0% |
| Manufacturing | 10,000 | -1,000 | -0.3% | -4.8% | -7.2% | -4.8% |
| Average Weekly Hours | 33.7 | 33.6 | 33.6 | 33.7 | 33.8 | 34.0 |
| Average Hourly Earnings | 0.3% | 0.1% | 1.9% | 2.7% | 2.9% | 3.8% |
| Unemployment Rate | 5.5% | 5.6% | 6.2% | 6.0% | 5.8% | 4.8% |

Tom Moeller
AuthorMore in Author Profile »Prior to joining Haver Analytics in 2000, Mr. Moeller worked as the Economist at Chancellor Capital Management from 1985 to 1999. There, he developed comprehensive economic forecasts and interpreted economic data for equity and fixed income portfolio managers. Also at Chancellor, Mr. Moeller worked as an equity analyst and was responsible for researching and rating companies in the economically sensitive automobile and housing industries for investment in Chancellor’s equity portfolio. Prior to joining Chancellor, Mr. Moeller was an Economist at Citibank from 1979 to 1984. He also analyzed pricing behavior in the metals industry for the Council on Wage and Price Stability in Washington, D.C. In 1999, Mr. Moeller received the award for most accurate forecast from the Forecasters' Club of New York. From 1990 to 1992 he was President of the New York Association for Business Economists. Mr. Moeller earned an M.B.A. in Finance from Fordham University, where he graduated in 1987. He holds a Bachelor of Arts in Economics from George Washington University.
More Economy in Brief


