 Global| Apr 01 2005
U.S. Payroll Growth Slowed, Unemployment Fell
by:Tom Moeller
|in:Economy in Brief
Summary
Non-farm payrolls rose just 110,000 in March and the prior month's gain was revised lower to 243,000. Consensus expectations had been for payrolls to rise 220,000 last month. The household survey, however, indicated that the [...]
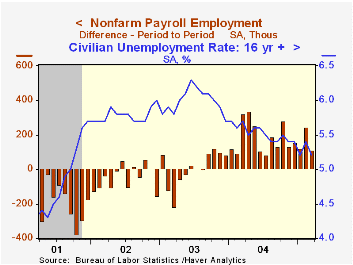
Non-farm payrolls rose just 110,000 in March and the prior month's gain was revised lower to 243,000. Consensus expectations had been for payrolls to rise 220,000 last month.
The household survey, however, indicated that the unemployment rate fell back to 5.2% as a result of a 357,000 (+1.5% y/y) worker rise in employment. The number of job losers fell 196,000 (-15.4% y/y). The labor force rose 25,000 (1.0% y/y) but the labor force participation rate held steady at a low 65.8% versus a high in 2000 of 67.3%.
Factory sector payrolls fell 8,000 and the prior month's gain was revised lower. The breadth of hiring gain rose slightly to a still narrow 44.0%. Six-month breadth was only 39.3%.
Private service producing payrolls rose 77,000 (1.9% y/y) in March and the prior month's gain was lowered. The slowdown in hiring versus earlier months spread throughout industry. Professional & business service jobs grew 27,000 (3.8% y/y) and financial jobs edged up 2,000 (2.0% y/y). Jobs in retailing fell 9,700 (+0.6% y/y) though the gain in education & health services jobs firmed to 23,000 (2.3% y/y). Total government employment rose 9,000 (0.8% y/y) but federal government jobs fell 1,000 (-0.4% y/y).
Construction jobs remained firm and rose 26,000 (3.6% y/y).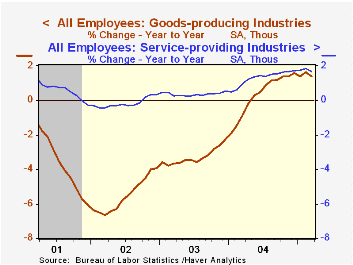
The index of aggregate hours worked (employment times hours worked) rose 0.1% (+2.5% y/y) in March and the 1Q average is 2.0% (AR) ahead of 4Q04.
Average hourly earnings increased 0.3% but earnings in manufacturing fell 0.2% (2.4% y/y).
Gains in U.S. Productivity: Stopgap Measures or Lasting Change? from the Federal Reserve Bank of San Francisco can be found here.
A Search for a Structural Phillips Curve from the Federal Reserve Bank of New York is available here.
| Employment | Mar | Feb | Y/Y | 2004 | 2003 | 2002 |
|---|---|---|---|---|---|---|
| Payroll Employment | 110,000 | 243,000 | 1.6% | 1.1% | -0.3% | -1.1% |
| Manufacturing | -8,000 | 15,000 | 0.2% | -1.2% | -4.9% | -7.2% |
| Average Weekly Hours | 33.7 | 33.7 | 33.7 | 33.7 | 33.7 | 33.8 |
| Average Hourly Earnings | 0.3% | 0.1% | 2.6% | 2.1% | 2.7% | 2.9% |
| Unemployment Rate | 5.2% | 5.4% | 5.7% | 5.5% | 6.0% | 5.8% |

Tom Moeller
AuthorMore in Author Profile »Prior to joining Haver Analytics in 2000, Mr. Moeller worked as the Economist at Chancellor Capital Management from 1985 to 1999. There, he developed comprehensive economic forecasts and interpreted economic data for equity and fixed income portfolio managers. Also at Chancellor, Mr. Moeller worked as an equity analyst and was responsible for researching and rating companies in the economically sensitive automobile and housing industries for investment in Chancellor’s equity portfolio. Prior to joining Chancellor, Mr. Moeller was an Economist at Citibank from 1979 to 1984. He also analyzed pricing behavior in the metals industry for the Council on Wage and Price Stability in Washington, D.C. In 1999, Mr. Moeller received the award for most accurate forecast from the Forecasters' Club of New York. From 1990 to 1992 he was President of the New York Association for Business Economists. Mr. Moeller earned an M.B.A. in Finance from Fordham University, where he graduated in 1987. He holds a Bachelor of Arts in Economics from George Washington University.
More Economy in Brief


