 Global| Apr 01 2005
U.S. Payroll Growth Slowed, Unemployment Fell
by:Tom Moeller
|in:Economy in Brief
Summary
Non-farm payrolls rose just 110,000 in March and the prior month's gain was revised lower to 243,000. Consensus expectations had been for payrolls to rise 220,000 last month. The household survey, however, indicated that the [...]
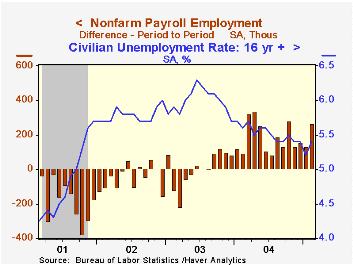
Non-farm payrolls rose just 110,000 in March and the prior month's gain was revised lower to 243,000. Consensus expectations had been for payrolls to rise 220,000 last month.
The household survey, however, indicated that the unemployment rate fell back to 5.2% as a result of a 357,000 (+1.5% y/y) worker rise in employment. The number of job losers fell 196,000 (-15.4% y/y). The labor force rose 25,000 (1.0% y/y) but the labor force participation rate held steady at a low 65.8% versus a high in 2000 of 67.3%.
Factory sector payrolls fell 8,000 and the prior month's gain was revised lower. The breadth of hiring gain rose slightly to a still narrow 44.0%. Six-month breadth was only 39.3%.
Private service producing payrolls rose 77,000 (1.9% y/y) in March and the prior month's gain was lowered. The slowdown in hiring versus earlier months spread throughout industry. Professional & business service jobs grew 27,000 (3.8% y/y) and financial jobs edged up 2,000 (2.0% y/y). Jobs in retailing fell 9,700 (+0.6% y/y) though the gain in education & health services jobs firmed to 23,000 (2.3% y/y). Total government employment rose 9,000 (0.8% y/y) but federal government jobs fell 1,000 (-0.4% y/y).
Construction jobs remained firm and rose 26,000 (3.6% y/y).
The index of aggregate hours worked (employment times hours worked) rose 0.1% (+2.5% y/y) in March and the 1Q average is 2.0% (AR) ahead of 4Q04.
Average hourly earnings increased 0.3% but earnings in manufacturing fell 0.2% (2.4% y/y).
Gains in U.S. Productivity: Stopgap Measures or Lasting Change? from the Federal Reserve Bank of San Francisco can be found here.
A Search for a Structural Phillips Curve from the Federal Reserve Bank of New York is available here.
| Employment | Mar | Feb | Y/Y | 2004 | 2003 | 2002 |
|---|---|---|---|---|---|---|
| Payroll Employment | 110,000 | 243,000 | 1.6% | 1.1% | -0.3% | -1.1% |
| Manufacturing | -8,000 | 15,000 | 0.2% | -1.2% | -4.9% | -7.2% |
| Average Weekly Hours | 33.7 | 33.7 | 33.7 | 33.7 | 33.7 | 33.8 |
| Average Hourly Earnings | 0.3% | 0.1% | 2.6% | 2.1% | 2.7% | 2.9% |
| Unemployment Rate | 5.2% | 5.4% | 5.7% | 5.5% | 6.0% | 5.8% |
by Tom Moeller April 1, 2005
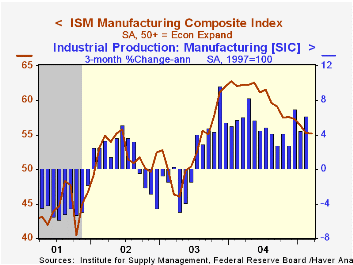
The Institute of Supply Management reported that the Composite Index of activity in the manufacturing sector remained about unchanged in March at 55.2 versus 55.3 in February. Consensus expectations had been for 55.0.
During the last twenty years there has been a 69% correlation between the level of the Composite Index and the three month growth in factory sector industrial production.
Only the new orders (57.1) and inventories (54.1) components rose. The production index (56.5) continued its slide from the January '04 peak of 69.0 and the employment index (53.3) reversed all of the prior two months' gains. During the last twenty years there has been a 69% correlation between the level of the ISM Employment Index and the three month growth in factory sector employment.
The vendor deliveries index (52.5) fell sharply to the lowest level since 2003 and the index of export orders (55.4) also fell hard to the lowest in six months.
The prices paid index recovered more than all of the prior two months' decline but remained off the April '04 high of 88.0.
| ISM Manufacturing Survey | March | Feb | March '04 | 2004 | 2003 | 2002 |
|---|---|---|---|---|---|---|
| Composite Index | 55.2 | 55.3 | 62.3 | 60.5 | 53.3 | 52.4 |
| New Orders Index | 57.1 | 55.8 | 65.3 | 63.5 | 57.9 | 56.5 |
| Prices Paid Index (NSA) | 73.0 | 65.5 | 86.0 | 79.8 | 59.6 | 57.6 |
by Tom Moeller April 1, 2005
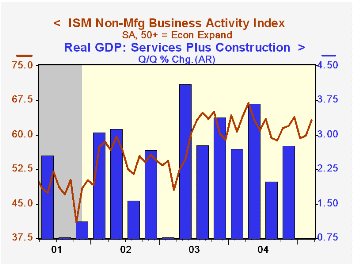
The Institute for Supply Management reported that in March the Business Activity Index for the non-manufacturing sector rose for the second consecutive month to 63.1 from 59.8 the prior month.
Since the series' inception in 1997 there has been a 50% correlation between the Business Activity Index and the q/q change in real GDP for services plus construction.
The new orders index rose to 62.1 while the employment sub index fell moderately m/m from the series' high in February. Since the series' inception in 1997 there has been a 60% correlation between the level of the ISM non-manufacturing employment index and the m/m change in payroll employment in the service producing plus the construction industries.
Pricing power eased again m/m to the lowest level in a year.
ISM surveys more than 370 purchasing managers in more than 62 industries including construction, law firms, hospitals, government and retailers. The non-manufacturing survey dates only to July 1997, therefore its seasonal adjustment should be viewed tentatively.Business Activity Index for the non-manufacturing sector reflects a question separate from the subgroups mentioned above. In contrast, the NAPM manufacturing sector composite index is a weighted average five components.
| ISM Nonmanufacturing Survey | Mar | Feb | Mar '04 | 2004 | 2003 | 2002 |
|---|---|---|---|---|---|---|
| Business Activity Index | 63.1 | 59.8 | 64.0 | 62.4 | 58.2 | 55.1 |
| Prices Index | 65.6 | 66.4 | 64.8 | 69.0 | 56.8 | 54.0 |
by Tom Moeller April 1, 2005
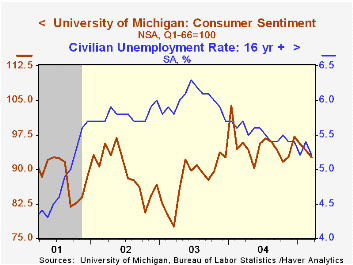
The University of Michigan's March reading of consumer sentiment at 92.6 about matched Consensus expectations, ended the month down from the preliminary indication of 92.9 and was 1.6% lower than February.
Sentiment has fallen in each of the last three months and is off 10.8% from the January '04 peak. During the last ten years there has been a 75% (inverse) correlation between the level of consumer sentiment and the unemployment rate.
The reading of current conditions fell for the second month. The 1.1% decline reflected a sharp decline in sentiment regarding current conditions for buying vehicles.
Consumer expectations slipped for the third consecutive month due to a drop in expected business conditions in six months. This reading is down 27.3% from the January '04 high.
The University of Michigan survey is not seasonally adjusted.The mid-month survey is based on telephone interviews with 250 households nationwide on personal finances and business and buying conditions. The survey is expanded to a total of 500 interviews at month end.
| University of Michigan | Mar | Feb | Y/Y | 2004 | 2003 | 2002 |
|---|---|---|---|---|---|---|
| Consumer Sentiment | 92.6 | 94.1 | -3.3% | 95.2 | 87.6 | 89.6 |
| Current Conditions | 108.0 | 109.2 | 1.1% | 105.6 | 97.2 | 97.5 |
| Consumer Expectations | 82.8 | 84.4 | -6.8% | 88.5 | 81.4 | 84.6 |
by By Carol Stone April 1, 2005
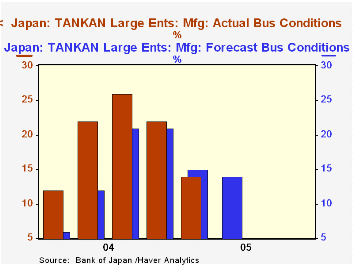
The TANKAN Survey for March shows generally less favorable readings for Japanese business. But "less favorable that what?" News stories highlighted the so-called Headline Series, large manufacturing companies. These firms' results for March came at +14, well below December's +22 and also weaker than December's forecast value for March of +15. This is the lowest outturn since March last year, which was +12 and also the first time since the late 2003 reorganization of the TANKAN survey that these firms have fallen short of their own forecast from just three months prior. Thus, the "bad news" in the TANKAN report.
Other segments of Japanese business performed relatively better, however. Large nonmanufacturing firms did better at +11 than their forecast of +10 and they held steady with December's result of +11. Medium and small companies had less positive assessments of their business conditions than in December, but better than they were expecting. Medium-sized manufacturing firms, for example, saw a result of +6, considerably better than their projection of +2. The performance still slowed from December, but there was not as much deterioration as they had anticipated.
The mixed picture in the TANKAN survey follows similarly mixed readings in other measures of Japanese activity. Industrial production fell in February following a strong January gain, and services ("tertiary") activity also rose sharply in January. Unemployment ticked higher in February, but from a six-year low. Employment is very erratic, apparently struggling to establish a rising trend. The Japanese economy overall is struggling to establish a rising trend, and just as it seemed to be achieving that, much higher energy and raw material prices have acted to constrain those nascent gains. 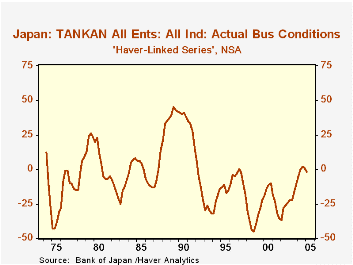
A reminder that in the Haver databases, we present the TANKAN data two ways. Owing to the restructuring of the survey classification scheme and new sampling last March, we have segregated the recent detail data into new series in the "Japan" database. In summary data in the "G10" database, we link the all industry-all enterprise data with the history that uses the old methodology. This broad aggregate is less affected by the Bank of Japan's reorganization of the categories. This special linked series dipped back below 0 in this report to -2, after two quarters of small positive values. Even so, these past three quarters still constitute the best performance in this series since 1991.
| JAPAN: Business Conditions: % Favorable minus % Unfavorable |
March 2005
December 2004
September 2004
||||||
|---|---|---|---|---|---|---|
| Forecast for Jun | Actual | Forecast for Mar | Actual | Forecast for Dec | Actual | |
| All Firms | -2 | -2 | -3 | 1 | 0 | 2 |
| Large Firms* | 12 | 13 | 12 | 16 | 15 | 19 |
| Manufacturing ("Headline Series") | 14 | 14 | 15 | 22 | 21 | 26 |
| Nonmanufacturing | 10 | 11 | 10 | 11 | 10 | 11 |
| Medium-Sized Firms** | -1 | 0 | -1 | 2 | 3 | 5 |
| Manufacturing | 2 | 6 | 2 | 11 | 10 | 14 |
| Nonmanufacturing | -4 | -4 | -3 | -4 | -2 | -2 |
| Small Firms*** | -11 | -9 | -12 | -7 | -9 | -9 |
| Manufacturing | -2 | 0 | -1 | 5 | 3 | 5 |
| Nonmanufacturing | -15 | -14 | -18 | -14 | -16 | -17 |

Tom Moeller
AuthorMore in Author Profile »Prior to joining Haver Analytics in 2000, Mr. Moeller worked as the Economist at Chancellor Capital Management from 1985 to 1999. There, he developed comprehensive economic forecasts and interpreted economic data for equity and fixed income portfolio managers. Also at Chancellor, Mr. Moeller worked as an equity analyst and was responsible for researching and rating companies in the economically sensitive automobile and housing industries for investment in Chancellor’s equity portfolio. Prior to joining Chancellor, Mr. Moeller was an Economist at Citibank from 1979 to 1984. He also analyzed pricing behavior in the metals industry for the Council on Wage and Price Stability in Washington, D.C. In 1999, Mr. Moeller received the award for most accurate forecast from the Forecasters' Club of New York. From 1990 to 1992 he was President of the New York Association for Business Economists. Mr. Moeller earned an M.B.A. in Finance from Fordham University, where he graduated in 1987. He holds a Bachelor of Arts in Economics from George Washington University.
More Economy in Brief


