 Global| Jun 04 2010
U.S. Payroll Gain Is Propelled by 2010 Census Hiring, But Private-Sector Hiring Remains Soft
by:Tom Moeller
|in:Economy in Brief
Summary
On the surface, the 431,000 gain in May payrolls after an unrevised 290,000 April rise looks strong but, in fact, it was not. First, the increase was raised by the one-time hiring of 411,000 Census workers. Second, the gain actually [...]
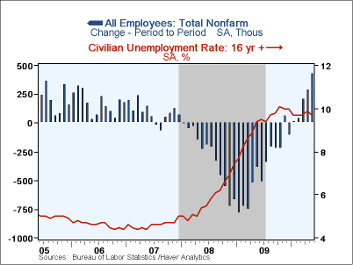
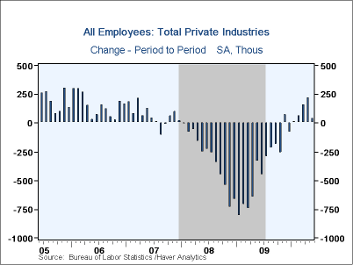
On the surface, the 431,000 gain in May payrolls after an unrevised 290,000 April rise looks strong but, in fact, it was not. First, the increase was raised by the one-time hiring of 411,000 Census workers. Second, the gain actually fell short of Consensus expectations for a 508,000 rise in the total. Lastly, the 41,000 gain in private sector payrolls was the weakest since January.
The shortfall in private sector was broad-based.
Construction sector hiring fell 35,000 and reversed the increases in
the prior two months. Private service-sector hiring rose just 37,000
following firmer gains during five of the prior six months. The
weakness reflected a 6,600 decline (-0.8% y/y) in retail sector hiring,
a 12,000 shortfall (-2.2% y/y) in financial sector employment and a
soft 2,000 increase (-0.3% y/y) in leisure & hospitality
jobs.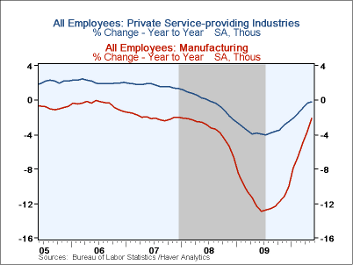
There were some bright spots in the hiring figures. The 29,000 rise in factory payrolls was the fifth in a row. Health care jobs rose 13,100 (1.9% y/y) though that was the weakest increase since April of last year. Finally, temporary jobs rose 31,000, on a par with the prior three months' increases but off from the earlier gains. Perhaps also salvaging the sense of disappointment in the overall payroll employment figures was the one-month diffusion index. The 54.1 figure showed that hiring was positive in more industries than not. Yet another caveat is that this was the lowest figure since January.
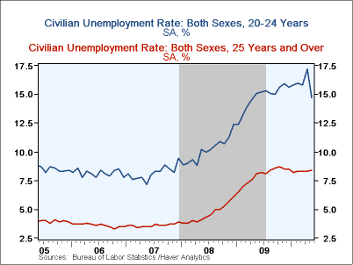
Also countering some sense of labor-market softness was a decline in the civilian unemployment rate to 9.7%, although that just reversed the April increase. Moreover, the decline was all due to a 322,000 shrinkage (-0.4% y/y) in the labor force, the first drop since December. Household sector employment, in fact, also declined 35,000 (-0.7% y/y) which was the first drop this year. Of note should be that the unemployment rate for ages 20-24 fell sharply to 14.7% from 17.2%. The rate for those 25 and over rose to 8.4%, its highest this year, due to expansion in the labor force. The number of employed rose a respectable 129,000 (3.8% y/y). Finally, the broadest measure of unemployment which adds marginally attached workers and those working part-time for economic reasons to the unemployed slipped to 16.6% from the 4Q '09 high of 17.3%.
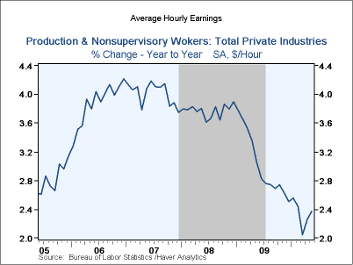
Back to the establishment survey, the gain in the length of the average workweek to 34.2 hours also was encouraging. It raised the average 2Q index of aggregate hours worked (employment times hours) by 3.7% (AR) from 1Q after that quarter's 2.3% increase. That could suggest faster real GDP growth versus 3.0% in 1Q. Finally, average hourly earnings rose 0.2% and that lifted the y/y increase to 2.4% from its 2.1% low in March.
The figures referenced above are available in Haver's USECON database. Additional detail can be found in the LABOR and in the EMPL databases.
Subsidizing Job Creation in the Great Recession from the Federal Reserve Bank of New York is available here.
| Employment: 000s | May | April | March | Y/Y | 2009 | 2008 | 2007 |
|---|---|---|---|---|---|---|---|
| Payroll Employment | 431 | 290 | 208 | -0.4% | -4.3% | -0.6% | 1.1% |
| Previous | -- | 290 | 230 | -- | -- | -- | -- |
| Manufacturing | 49 | 40 | 19 | -2.1% | -11.3% | -3.4% | -2.0% |
| Construction | -35 | 14 | 27 | -8.6% | -15.7% | -6.1% | -0.8% |
| Private Service Producing | 37 | 156 | 101 | -0.2% | -3.4% | -0.2% | 1.7% |
| Government | 390 | 72 | 50 | -1.5% | 0.2% | 1.3% | 1.1% |
| Average Weekly Hours | 34.2 | 34.1 | 34.0 | 33.9 (May '09) | 33.1 | 33.6 | 33.8 |
| Average Hourly Earnings | 0.3% | 0.1% | 0.0% | 1.9% | 2.7% | 3.1% | 3.2% |
| Unemployment Rate | 9.7% | 9.9% | 9.7% | 9.4%(May '09) | 9.3% | 5.8% | 4.6% |
by Tom Moeller June 4, 2010
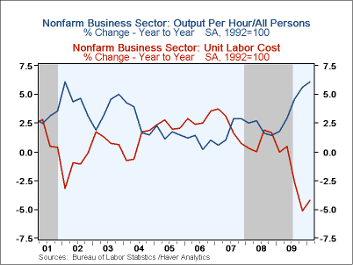
Slower growth in real GDP last quarter accompanied more of a slowdown in worker productivity than reported last month. Nonfarm business sector grew 2.8% (AR) versus the initial estimate of 3.6%, down from 6.3% during 4Q. Nevertheless, the 6.1% surge in U.S. worker productivity during the last four quarters matched the strongest since early-1962. New technologies, improved work techniques and improved labor skill-sets have paid off. Productivity last quarter fell short of Consensus expectations for a 3.4% rise.p
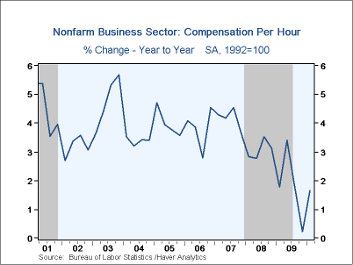
The slowdown in 1Q productivity occurred as real output growth slowed to 4.0% (3.0% y/y) from 7.0% during 4Q. That was met by an upwardly-revised gain in hours worked of 1.1% (-3.0% y/y) from 0.7% in 4Q. Growth in compensation costs also accelerated to 1.5% (1.6% y/y) after declines in three of the prior four quarters. Four-quarter growth in compensation was nearly the slowest since 1995.
The rate of decline in 1Q unit labor costs eased to 1.3% as compensation picked up. Regardless, the four-quarter decline in costs of 4.2% was near the largest on record.
In the factory sector alone, worker productivity growth also slowed sharply to a downwardly-revised 1.5% (7.2% y/y) versus 6.5% during 4Q '09. The slowdown occurred as output rose an accelerated 7.2% (3.2% y/y) but growth in hours-worked picked up to 5.6% (-3.8% y/y) following a slight 4Q decline. Compensation fell negligibly but the y/y change of 1.8% was stronger than reported initially. It remained, however, near the weakest since 2006. The combination of the rise in productivity and the slip in compensation dropped unit labor costs by a lessened 1.5%.
The productivity & cost figures are available in Haver's USECON database.
Yesterday's comments by Fed Chairman Ben S. Bernanke on Small Business Financing can be found here.
by Robert Brusca June 4, 2010
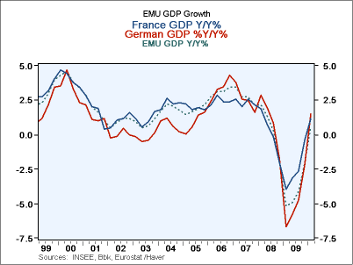 ·
EMU GDP performed slightly better than expected in 2010-Q1. GDP is now
up by 0.6% Yr/Yr the first positive Yr/Yr result since the downturn
began. Austria and Italy post the strongest Q/Q numbers in 2010-Q1.
Germany and France show the strongest Yr/Yr growth in Q1. The best of
the Euro-Area, on this score, trail the US, Japan and Switzerland.
Consumption in Europe continues to falter. Growth in Q1 is substantially about exports. Quite apart from the GDP figure itself Europe needs to get more balanced growth and it needs more home-grown growth. Exports rose at a 10% pace in Q1 as private consumption fell by 0.4%. Domestic demand was up mostly on government spending initiatives.
As the table shows Greece is still under pressure. The hardest thing for Greece is to have to endure a period of fiscal austerity right on the heels of a difficult recession.
Spain has posted positive growth for 2010-Q1 but it too faces fiscal austerity in the quarters ahead plus a lingering problem with its construction sector and the banking problems that have been connected with that. Portugal has not released its Q1 GDP result yet, nor has Ireland.
f there are to be synergies in the Euro-Area its member countries will have to brew home grown prosperity instead of taking it from abroad with export growth. Europe is lacking balance in a number of ways as this financial crisis and its aftermath, the euro-debt crisis, clearly demonstrate. Balance in growth is another factor lacking in the Euro-Area.
| Euro-Area and main G-10 country GDP Results | |||||||
|---|---|---|---|---|---|---|---|
| Quarter Over Quarter-Saar | Year/Year | ||||||
| GDP | Q1-10 | Q4-09 | Q3-09 | Q1-10 | Q4-09 | Q3-09 | Q2-09 |
| EMU | 0.8% | 0.5% | 1.6% | 0.6% | -2.1% | -4.1% | -4.9% |
| Austria | 3.5% | 1.3% | 2.8% | 0.8% | -1.5% | -3.6% | -5.0% |
| France | 0.5% | 2.2% | 1.0% | 1.2% | -0.4% | -2.6% | -3.2% |
| Germany | 0.6% | 0.7% | 2.9% | 1.5% | -2.2% | -4.8% | -5.8% |
| Greece | -3.1% | -3.1% | -1.9% | -2.3% | -2.5% | -2.5% | -1.9% |
| Italy | 2.1% | -0.2% | 1.5% | 0.6% | -2.8% | -4.7% | -6.1% |
| The Netherlands | 1.0% | 1.5% | 2.3% | 0.1% | -2.6% | -4.0% | -5.2% |
| Spain | 0.3% | -0.6% | -1.1% | -1.3% | -3.1% | -4.0% | -4.2% |
| UK | 1.2% | 2.0% | -1.2% | -0.2% | -3.1% | -5.3% | -5.9% |
| US | 3.0% | 5.6% | 2.2% | 2.5% | 0.1% | -2.6% | -3.8% |
| Japan | 4.9% | 4.2% | 0.5% | 4.2% | -1.4% | -4.8% | -6.0% |
| Switzerland | 1.6% | 3.5% | 2.2% | 1.7% | 0.2% | -1.4% | -2.5% |
Tom Moeller
AuthorMore in Author Profile »Prior to joining Haver Analytics in 2000, Mr. Moeller worked as the Economist at Chancellor Capital Management from 1985 to 1999. There, he developed comprehensive economic forecasts and interpreted economic data for equity and fixed income portfolio managers. Also at Chancellor, Mr. Moeller worked as an equity analyst and was responsible for researching and rating companies in the economically sensitive automobile and housing industries for investment in Chancellor’s equity portfolio. Prior to joining Chancellor, Mr. Moeller was an Economist at Citibank from 1979 to 1984. He also analyzed pricing behavior in the metals industry for the Council on Wage and Price Stability in Washington, D.C. In 1999, Mr. Moeller received the award for most accurate forecast from the Forecasters' Club of New York. From 1990 to 1992 he was President of the New York Association for Business Economists. Mr. Moeller earned an M.B.A. in Finance from Fordham University, where he graduated in 1987. He holds a Bachelor of Arts in Economics from George Washington University.
More Economy in Brief
 Global| Feb 05 2026
Charts of the Week: Balanced Policy, Resilient Data and AI Narratives
by:Andrew Cates


