 Global| Jun 04 2004
U.S. Non-farm Payroll Growth Strong & Broad Based
by:Tom Moeller
|in:Economy in Brief
Summary
Non-farm payrolls rose 248,000 in May. That about matched Consensus expectations for a 225,000 rise, but upward revisions to prior months added a further note of strength to recent reports. Payroll growth in April was revised to [...]
Non-farm payrolls rose 248,000 in May. That about matched Consensus expectations for a 225,000 rise, but upward revisions to prior months added a further note of strength to recent reports. Payroll growth in April was revised to 346,000 from 288,000 and the March gain was revised to 353,000 from 337,000.
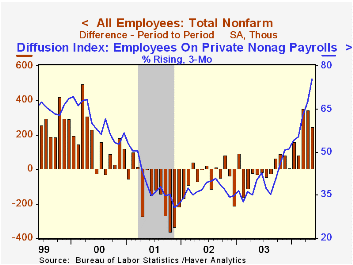
An increased breadth of hiring was indicated by the three-month diffusion index for private non-farm payrolls which jumped to 75.4% from 40.3% last year and from 37.0% in 2002. It was the strongest diffusion of employment growth since early 1998.
Manufacturing sector payrolls rose 32,000 following upwardly revised figures for the prior two months. Gains were widespread. The three-month diffusion index for manufacturing payrolls improved to 70.2% from just 18.6% last year and 15.5% in 2002.
Service producing payrolls rose 176,000 (1.2% y/y) despite a 27,000 worker decline in government employment (0.0% y/y). Private service payrolls rose 203,000 (1.5% y/y) and gains were broad based.
Construction jobs were strong again, up 37,000 (2.9% y/y).
The index of aggregate hours worked (employment times hours worked) rose 0.3% following an upwardly revised 0.4% April gain, up 3.1% (AR) versus 1Q.
Growth in average hourly earnings was steady at 0.3% (2.2% y/y). A 0.1% decline in factory sector earnings was offset by a 0.4% (2.1% y/y) gain in private services.
From the separate household survey the unemployment rate held steady at an expected 5.6%. Employment surged another 196,000 (0.9% y/y) and the labor force grew 233,000 (+0.3% y/y). The labor force participation rate was unchanged for the fourth month at 65.9% versus 67.1% averaged from 1997-2000.
| Employment | May | April | Y/Y | 2003 | 2002 | 2001 |
|---|---|---|---|---|---|---|
| Payroll Employment | 248,000 | 346,000 | 1.0% | -0.3% | -1.1% | 0.0% |
| Manufacturing | 32,000 | 29,000 | -1.2% | -4.8% | -7.2% | -4.8% |
| Average Weekly Hours | 33.8 | 33.8 | 33.7 | 33.7 | 33.8 | 34.0 |
| Average Hourly Earnings | 0.3% | 0.3% | 2.2% | 2.7% | 2.9% | 3.8% |
| Unemployment Rate | 5.6% | 5.6% | 6.1% | 6.0% | 5.8% | 4.8% |

Tom Moeller
AuthorMore in Author Profile »Prior to joining Haver Analytics in 2000, Mr. Moeller worked as the Economist at Chancellor Capital Management from 1985 to 1999. There, he developed comprehensive economic forecasts and interpreted economic data for equity and fixed income portfolio managers. Also at Chancellor, Mr. Moeller worked as an equity analyst and was responsible for researching and rating companies in the economically sensitive automobile and housing industries for investment in Chancellor’s equity portfolio. Prior to joining Chancellor, Mr. Moeller was an Economist at Citibank from 1979 to 1984. He also analyzed pricing behavior in the metals industry for the Council on Wage and Price Stability in Washington, D.C. In 1999, Mr. Moeller received the award for most accurate forecast from the Forecasters' Club of New York. From 1990 to 1992 he was President of the New York Association for Business Economists. Mr. Moeller earned an M.B.A. in Finance from Fordham University, where he graduated in 1987. He holds a Bachelor of Arts in Economics from George Washington University.
More Economy in Brief


