 Global| Jun 24 2009
U.S. New Home Sales Stay Low As Prices Firm
by:Tom Moeller
|in:Economy in Brief
Summary
Sales of new single-family homes during May continued the sideways movement of 2009. Sales were stable with April at 342,000 units (AR) and have shown little month-to-month change this year. That stability, however, follows a one- [...]
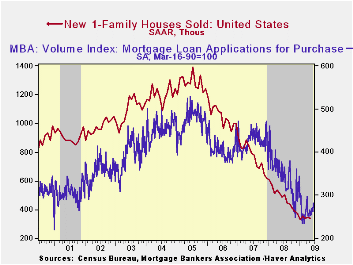 Sales
of new single-family homes during May continued the sideways movement
of 2009. Sales were stable with April at 342,000 units (AR) and have
shown little month-to-month change this year. That stability, however,
follows a one-third sales decline over the last year and a
three-quarters decline since the 2005 peak. May sales fell short of
Consensus expectations for sales of 360,000 units. The new home sales
figures are available in Haver's USECON database.
Sales
of new single-family homes during May continued the sideways movement
of 2009. Sales were stable with April at 342,000 units (AR) and have
shown little month-to-month change this year. That stability, however,
follows a one-third sales decline over the last year and a
three-quarters decline since the 2005 peak. May sales fell short of
Consensus expectations for sales of 360,000 units. The new home sales
figures are available in Haver's USECON database.
 Around the country sales patterns continued to vary. Sales in the
Northeast and in the Midwest rose last month but sales barely inched
higher out West. Sales in the South reversed their April gain and fell
back to near the record low.
Around the country sales patterns continued to vary. Sales in the
Northeast and in the Midwest rose last month but sales barely inched
higher out West. Sales in the South reversed their April gain and fell
back to near the record low.
The modest firming of home sales continued to strengthen prices. The median price for a new single-family home rose 4.2% last month to $221,600 after a like gain during April. Nevertheless, prices have fallen 3.5% over the last twelve months as well as since yearend 2008. Since their peak early in 2007, new home prices have fallen by roughly one-quarter.
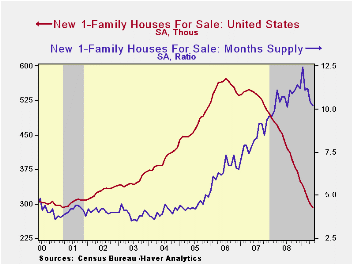
Price weakness has helped move the
inventory of unsold homes which has fallen by nearly one-half since the
peak during 2006. 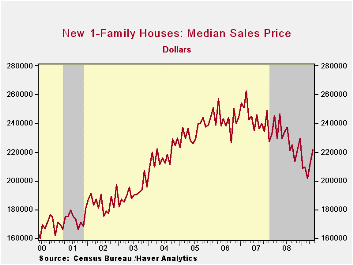 In each of the country's regions, inventories are
down by roughly one-third just during the last year. The
month's supply of new homes for sale also has started to drop. In May
the months supply in inventory fell to its lowest level since last
July. But there's more inventory to move with lower prices if sales
remain low.
In each of the country's regions, inventories are
down by roughly one-third just during the last year. The
month's supply of new homes for sale also has started to drop. In May
the months supply in inventory fell to its lowest level since last
July. But there's more inventory to move with lower prices if sales
remain low.
A related development indicated that mortgage applications for purchase of a home rose last week to the highest level since early April (-15.9% y/y). These figures from the Mortgage Bankers Association are available in Haver's SURVEYW database.
| US New Homes | May | April | Y/Y | 2008 | 2007 | 2006 |
|---|---|---|---|---|---|---|
| Total Sales (SAAR, 000s) | 342 | 344 | -32.8% | 479 | 768 | 1,049 |
| Northeast | 27 | 21 | -12.9 | 35 | 64 | 64 |
| Midwest | 51 | 43 | -32.0 | 69 | 118 | 161 |
| South | 184 | 201 | -35.9 | 264 | 408 | 559 |
| West | 80 | 79 | -31.0 | 111 | 178 | 266 |
| Median Price (NSA, $) | 221,600 | 212,600 | -3.4 | 230,408 | 243,742 | 243,067 |

Tom Moeller
AuthorMore in Author Profile »Prior to joining Haver Analytics in 2000, Mr. Moeller worked as the Economist at Chancellor Capital Management from 1985 to 1999. There, he developed comprehensive economic forecasts and interpreted economic data for equity and fixed income portfolio managers. Also at Chancellor, Mr. Moeller worked as an equity analyst and was responsible for researching and rating companies in the economically sensitive automobile and housing industries for investment in Chancellor’s equity portfolio. Prior to joining Chancellor, Mr. Moeller was an Economist at Citibank from 1979 to 1984. He also analyzed pricing behavior in the metals industry for the Council on Wage and Price Stability in Washington, D.C. In 1999, Mr. Moeller received the award for most accurate forecast from the Forecasters' Club of New York. From 1990 to 1992 he was President of the New York Association for Business Economists. Mr. Moeller earned an M.B.A. in Finance from Fordham University, where he graduated in 1987. He holds a Bachelor of Arts in Economics from George Washington University.
More Economy in Brief


