 Global| Dec 23 2010
U.S. New Home Sales Recover Some as Prices Climb Back into Previous Range
Summary
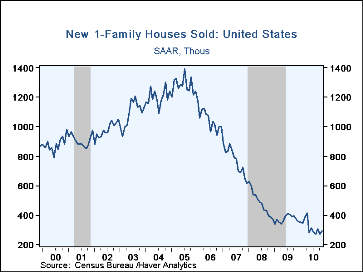
Thin markets often behave erratically. So it is these days with home sales as well as with financial assets. Total new home sales rose to 290,000 SAAR in November from 275,000 in October, revised from 283,000. This volume change, at [...]
Thin markets often behave erratically. So it is these days with home sales as well as with financial assets. Total new home sales rose to 290,000 SAAR in November from 275,000 in October, revised from 283,000. This volume change, at 5.5% month-on-month, is not large, but it follows -10.7% in October and +12.2% in September. So there's no visible trend or sign of stability.
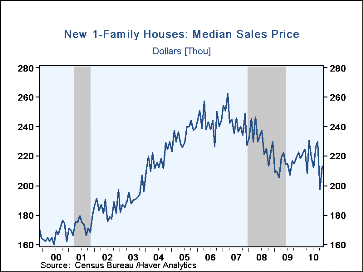
Prices, which concerned Tom Moeller here last month with a plunge of 13.9%, were revised up slightly and then rebounded by 8.0% in November. This wide price move is impressive since these are "median" prices, the level in the middle of the distribution, and not the "average" gauge that is often impacted by movements on the extreme low or high end. So this pattern in the medians says that the entire array of home prices moved down sharply in October and back upward in November.
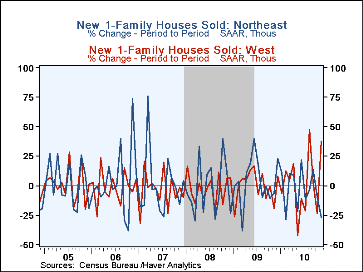
While the national sales total moved only moderately in November, the regional performance was quite uneven. The national sales gain came because of increases in the South, from 156,000 to 165,000, a 5.8% rise, and the West, from 51,000 to 70,000, a 37.3% jump. Sales in the Midwest declined to 33,000 from 38,000, a 13.2% decrease, and those in the Northeast by 8,000 to 22,000, representing a 26.7% fall. A quick look at the third graph here indicates that monthly moves in those regional figures don't tell us anything at all about the underlying condition of those housing markets.
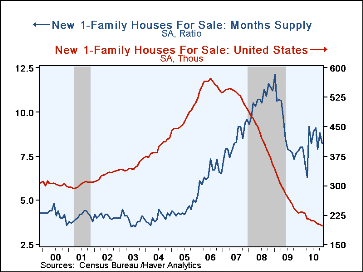
Perhaps one indicator of housing market health is the months' supply of homes on the market. The total inventory at the end of November was 197,000 houses -- as it happens, the smallest amount since March 1968. At the current sales rate, this supply of unsold homes is 8.2 months' worth of sales, a period equal to the average for all the months of 2010 so far. Perhaps we can say that this inventory/sales situation has stabilized, which would be an important precursor to renewed growth in building activity.
The data in this report are available in Haver's USECON database.
| US New Homes | November | October | September | Y/Y % | 2009 | 2008 | 2007 |
|---|---|---|---|---|---|---|---|
| Total Sales (SAAR, 000s) | 290 | 275 | 308 | -21.2 | 372 | 481 | 769 |
| Northeast | 22 | 30 | 33 | -29.0 | 32 | 35 | 64 |
| Midwest | 33 | 38 | 48 | -53.5 | 54 | 69 | 118 |
| South | 165 | 156 | 160 | -12.7 | 201 | 264 | 409 |
| West | 70 | 51 | 67 | -9.1 | 87 | 113 | 178 |
| Median Price (NSA, $) | 213,000 | 197,200 | 229,300 | -2.7 | 214,500 | 230,408 | 243,742 |
Carol Stone, CBE
AuthorMore in Author Profile »Carol Stone, CBE came to Haver Analytics in 2003 following more than 35 years as a financial market economist at major Wall Street financial institutions, most especially Merrill Lynch and Nomura Securities. She had broad experience in analysis and forecasting of flow-of-funds accounts, the federal budget and Federal Reserve operations. At Nomura Securities, among other duties, she developed various indicator forecasting tools and edited a daily global publication produced in London and New York for readers in Tokyo. At Haver Analytics, Carol was a member of the Research Department, aiding database managers with research and documentation efforts, as well as posting commentary on select economic reports. In addition, she conducted Ways-of-the-World, a blog on economic issues for an Episcopal-Church-affiliated website, The Geranium Farm. During her career, Carol served as an officer of the Money Marketeers and the Downtown Economists Club. She had a PhD from NYU's Stern School of Business. She lived in Brooklyn, New York, and had a weekend home on Long Island.


