 Global| Apr 24 2009
U.S. New Home Sales Form A Bottom
by:Tom Moeller
|in:Economy in Brief
Summary
Sales of new single-family homes showed signs of forming a bottom after having declined by more than three-quarters since 2005. Sales during March slipped just 0.4% to 356,000 units after an upwardly revised 8.2% February increase. [...]
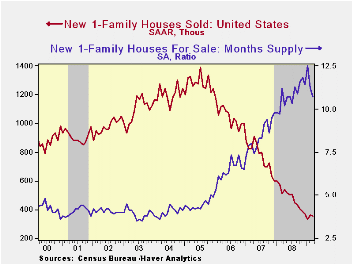
Sales of new single-family homes showed signs of forming a bottom after having declined by more than three-quarters since 2005. Sales during March slipped just 0.4% to 356,000 units after an upwardly revised 8.2% February increase. March sales exceeded Consensus expectations for 340,000 units.
The bottom, however, reflects divergent patterns across the country's regions. Sales in West rose sharply during the last two months though sales last quarter still were down 15.9% from 4Q'08. March sales in the South held steady after a sharp February gain and for the quarter fell a moderate 3.7%. Elsewhere in the country there's been little sign of stabilization of the downtrend. New home sales in the Midwest fell 7.8% last month after no change during February and for the quarter were down another 14.9%. Finally, in the Northeast new home sales fell to a record low and they've been dropping at a steady 60% annual rate.
Reflecting sales weakness was another decline in the median price for a new single-family home. At $201,400 the figure was off for the third straight month as homebuilders attempted to move inventory. Since their peak early in 2007, new home prices have fallen by roughly one-quarter.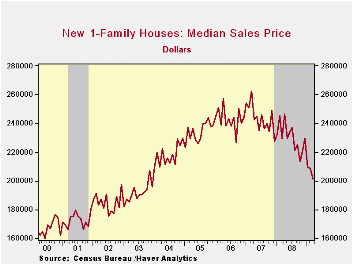
And the attempt to move inventory has been successful. The inventory of unsold homes is down by nearly one-half since the peak during 2006. In each of the country's regions, the inventory is down by one-quarter to one-third just during the last year.The month's supply of new homes for sale also has started to drop, in March to the lowest level since last July. But there's more inventory to move.
The new home sales figures are available in Haver's USECON database.
The Federal Reserve System published the annual financial statements for the combined Federal Reserve Banks. The report can be found here.
| US New Homes | March | February | Y/Y (%) | 2008 | 2007 | 2006 |
|---|---|---|---|---|---|---|
| Total Sales (SAAR, 000s) | 356 | 358 | -30.6 | 479 | 768 | 1,049 |
| Northeast | 19 | 28 | -32.1 | 35 | 64 | 64 |
| Midwest | 47 | 51 | -32.9 | 69 | 118 | 161 |
| South | 206 | 206 | -29.7 | 264 | 408 | 559 |
| West | 84 | 73 | -31.1 | 111 | 178 | 266 |
| Median Price (NSA, $) | 201,400 | 208,700 | -12.2 | 230,408 | 243,742 | 243,067 |

Tom Moeller
AuthorMore in Author Profile »Prior to joining Haver Analytics in 2000, Mr. Moeller worked as the Economist at Chancellor Capital Management from 1985 to 1999. There, he developed comprehensive economic forecasts and interpreted economic data for equity and fixed income portfolio managers. Also at Chancellor, Mr. Moeller worked as an equity analyst and was responsible for researching and rating companies in the economically sensitive automobile and housing industries for investment in Chancellor’s equity portfolio. Prior to joining Chancellor, Mr. Moeller was an Economist at Citibank from 1979 to 1984. He also analyzed pricing behavior in the metals industry for the Council on Wage and Price Stability in Washington, D.C. In 1999, Mr. Moeller received the award for most accurate forecast from the Forecasters' Club of New York. From 1990 to 1992 he was President of the New York Association for Business Economists. Mr. Moeller earned an M.B.A. in Finance from Fordham University, where he graduated in 1987. He holds a Bachelor of Arts in Economics from George Washington University.
More Economy in Brief


