 Global| Nov 26 2008
U.S. New-Home Sales Fell During October; Lowest Since 1991
by:Tom Moeller
|in:Economy in Brief
Summary
The U.S. Census Department reported that October sales of new single-family homes fell 5.3% m/m to 433,000 after a downwardly revised 0.7% September uptick. The level of sales in October was off by nearly 70% from the July 2005 peak [...]
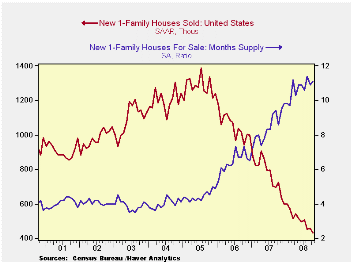
The U.S. Census Department reported that October sales of new single-family homes fell 5.3% m/m to 433,000 after a downwardly revised 0.7% September uptick. The level of sales in October was off by nearly 70% from the July 2005 peak and sales fell short of Consensus expectations for 443,000.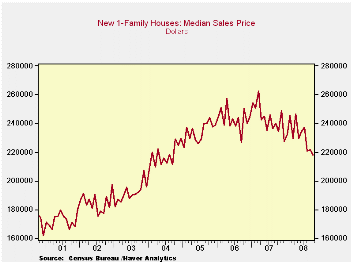
The m/m change in sales was quite mixed by region. Sales in the West dropped 18.0% and sales in the South were off 6.0%. These declines were countered by gains elsewhere in the country. New home sales in the Midwest sales recovered half of their September decline with a 6.0% gain and new home sales in the Northeast rose 22.6% to their highest level since June.
The median price for a new single-family home declined 1.7% to $218,000. The drop came after a 0.4% September gain that was better than the initial report of a m/m decline. Prices were off 7.0% y/y and new home prices in September were back to where they were late in 2004. The decline in home prices matched the 7.0% drop for September reported yesterday by the Office of Federal Housing Enterprise Oversight (FHFA). The FHFA figures, (formerly the Office of Federal Housing Enterprise Oversight (OFHEO), as well as the Census Dept. figures, are available in Haver's USECON database.
The number of new homes for purchase again fell again fell sharply, by 8.0% (-25.7% y/y). That reduced the inventory of unsold homes to the lowest level since mid-2004. In each of the country's regions, the inventory is down roughly one-quarter during the last year.
The month's supply of new homes for sale ticked higher m/m to 11.1 and that roughly has been the level since earlier this year.
| US New Homes | October | September | Y/Y (%) | 2007 | 2006 | 2005 |
|---|---|---|---|---|---|---|
| Total Sales (SAAR, 000s) | 433 | 457 | -40.1 | 768 | 1,049 | 1,279 |
| Northeast | 38 | 31 | -41.5 | 64 | 64 | 81 |
| Midwest | 71 | 67 | -44.5 | 118 | 161 | 203 |
| South | 233 | 248 | -38.5 | 408 | 559 | 638 |
| West | 91 | 111 | -39.7 | 178 | 266 | 356 |
| Median Price (NSA, $) | 218,000 | 221,700 | -7.0 | 243,742 | 243,067 | 234,208 |

Tom Moeller
AuthorMore in Author Profile »Prior to joining Haver Analytics in 2000, Mr. Moeller worked as the Economist at Chancellor Capital Management from 1985 to 1999. There, he developed comprehensive economic forecasts and interpreted economic data for equity and fixed income portfolio managers. Also at Chancellor, Mr. Moeller worked as an equity analyst and was responsible for researching and rating companies in the economically sensitive automobile and housing industries for investment in Chancellor’s equity portfolio. Prior to joining Chancellor, Mr. Moeller was an Economist at Citibank from 1979 to 1984. He also analyzed pricing behavior in the metals industry for the Council on Wage and Price Stability in Washington, D.C. In 1999, Mr. Moeller received the award for most accurate forecast from the Forecasters' Club of New York. From 1990 to 1992 he was President of the New York Association for Business Economists. Mr. Moeller earned an M.B.A. in Finance from Fordham University, where he graduated in 1987. He holds a Bachelor of Arts in Economics from George Washington University.
More Economy in Brief


