 Global| Mar 12 2008
U.S. Mortgage Foreclosures Continued To Surge
by:Tom Moeller
|in:Economy in Brief
Summary
The Mortgage Bankers' Association reported that during 4Q07, foreclosures were started on .83% of all mortgages outstanding. That was by far the highest foreclosure rate on record. Moreover, it raised the total for the full year to [...]
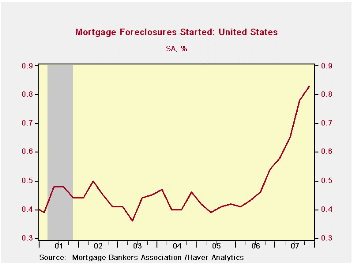
The Mortgage Bankers' Association reported that during 4Q07, foreclosures were started on .83% of all mortgages outstanding. That was by far the highest foreclosure rate on record. Moreover, it raised the total for the full year to 2.84% of the number outstanding.Foreclosure rates on both prime and subprime mortgages rose sharply last year
Foreclosures on all prime mortgage loans rose to 0.41% by
yearend and totaled 1.30% of those outstanding for the full year. That
was nearly double the rate during the prior nine years. 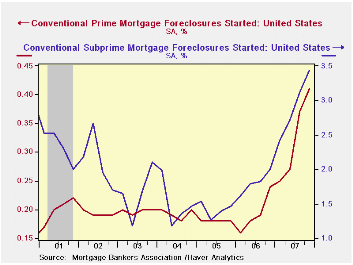
Though rates for prime fixed rate mortgages held steady at yearend at 0.22% of loans outstanding, the foreclosure rate for the year of 0.79% was a record and it was up from 0.56% during 2006. There were 25.8 million of these loans outstanding last year. Of the 6.5 million prime adjustable rate mortgages during 4Q, the foreclosure rate rose to 1.06%. That pulled the full year rate of foreclosures up to 3.23% which was nearly triple the rate during 2006.
As bad as the above data on prime debt was, the figures on subprime mortgage debt were far worse. Though short term interest rates fell slightly during the year the average level of rates was double that a few years earlier. In total, the rate of foreclosure on subprime mortgages rose to 3.44% of outstanding loans during 4Q '07. The rise pulled foreclosures for the full year to 11.71% of loans outstanding.
The foreclosure rate on subprime fixed rate debt rose to 1.52% of loans outstanding. That was up by half from the quarterly running rate in early 2006 and the rate for the year jumped to 5.55%.There were 2.5 million of these loans outstanding last year. On variable rate subprime debt, however, foreclosures soared to 5.29% of loans outstanding from 4.72% during 3Q. Seventeen percent of these loans were foreclosed on last year and there were 2.9 million of these loans on the books.
By the country's regions the Northeast saw an increase in the overall rate of foreclosure to 2.29% last year from 1.59% during 2006. In the Midwest that rate rose to 3.44% from 2.71%. The West saw an increase to 2.68% of loans outstanding from 1.18% in 2006 and in the South foreclosures were started last year on 2.69% of loans versus 1.73% in 2006.
The Rise and Fall of Subprime Mortgages from the Federal Reserve Bank of Dallas can be found here.
These data series are available in Haver's MBAMTG database.
| Mortgages in Foreclosure (%) | 4Q '07 | 3Q '07 | 4Q '06 | 2007 | 2006 | 2005 |
|---|---|---|---|---|---|---|
| All Mortgages | 0.83 | 0.78 | 0.54 | 2.84 | 1.84 | 1.64 |
| Conventional Prime | 0.41 | 0.37 | 0.24 | 1.30 | 0.77 | 0.72 |
| Fixed Rate | 0.22 | 0.22 | 0.16 | 0.79 | 0.56 | 0.61 |
| ARM | 1.06 | 1.02 | 0.41 | 3.23 | 1.19 | 0.75 |
| Subprime | 3.44 | 3.12 | 2.00 | 11.71 | 7.23 | 5.66 |
| Fixed Rate | 1.52 | 1.38 | 1.09 | 5.55 | 4.24 | 4.33 |
| ARM | 5.29 | 4.72 | 2.70 | 17.08 | 8.80 | 6.07 |
by Tom Moeller March 12, 2008
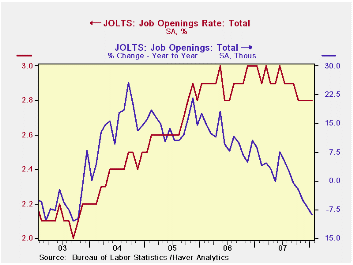
The Bureau of Labor Statistics reported in the Job Openings
& Labor Turnover Survey (JOLTS) that the January '08 job
openings rate was unchanged from the prior month at 2.8%. That level
was, however, down from early 2007. Past year's figures were revised. The
job openings rate is the number of job openings on the last business
day of the month as a percent of total employment plus job openings. In
private industries the rate fell in January to 2.9% from 3.0% in
December and from 3.2% in 2006.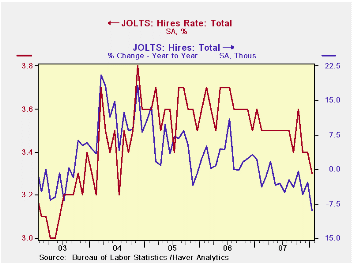
The actual number of total job openings fell 1.2% m/m to 3.925 million and the number of job openings was down 8.9% from one year earlier. Job openings in retail trade fell 16.7% y/y. They were down 34.6% in construction and down 14.0% in manufacturing. Education & health services jobs fell 3.1% y/y and leisure & hospitality job openings fell 7.1%. Only openings in the professional & business services industry rose, by 3.4% y/y.
The hires rate also fell m/m to 3.3% to its lowest level since 2004. The hires rate is the number of hires during the month divided by employment.The decline was across most industries. The actual number of January hires fell 3.6% (-9.0% y/y) to 4.545 million.
The job separations rate in January fell to 3.1% from 3.2% at yearend 2007 and from 3.3% at yearend 2006. Separations include quits, layoffs, discharges, and other separations as well as retirements. The level of job separations fell 4.1% since yearend 2006.
The JOLTS survey dates only to December 2000 but has since followed the movement in nonfarm payrolls, though the actual correlation between the two series is low.
A description of the Jolts survey and the latest release from the U.S. Department of Labor is available here.
| JOLTS (Job Openings & Labor Turnover Survey) | January | December | January '07 | 2007 | 2006 | 2005 |
|---|---|---|---|---|---|---|
| Job Openings, Total | ||||||
| Rate (%) | 2.8 | 2.8 | 3.0 | 2.8 | 3.0 | 2.8 |
| Total (000s) | 3,925 | 3,974 | 4,307 | 3,974 | 4,272 | 3,863 |
| Hires, Total | ||||||
| Rate (%) | 3.3 | 3.4 | 3.6 | 41.9 | 43.4 | 43.1 |
| Total (000s) | 4,545 | 4,717 | 4,992 | 57,771 | 59,153 | 57,501 |
by Robert Brusca March 12, 2008
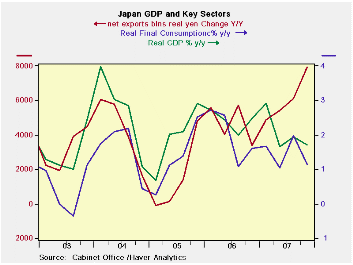
Japan’s GDP was revised lower in Q4 on weaker capital
spending. Japan's gross domestic product increased a real 0.9% in the
quarter during the October-December period, or 3.5% in annualized
terms. That was lower than the original estimate made a month ago of an
annualized 3.7% growth. Capital spending was revised down to a 2.0%
on-quarter rise from preliminary 2.9% advance.
Japan’s GDP picture shows differing trends. The chart shows
that net exports are continuing to push GDP to stronger growth rates.
But real personal consumption trends are decelerating. Exports are
still growing strongly while real imports are being curtailed by
domestic weakness. Domestic demand in general is weakening with a Y/Y
growth rate of just 0.2% in Q4. Gross fixed capital formation is
negative and showing a sharp contraction. Housing is a leading negative
investment sector. Business plant and equipment expenditures have
steadied at a less than a 1% growth pace. In the recent quarter
government spending accelerated sharply hiking the yr/yr pace. Private
consumption did pick up in the quarter but the year/year pace
decelerated nonetheless. With the yen rising Japan will either have to
compete harder in overseas markets or supplement trade-led growth with
stronger domestic demand.
For Japan, several cyclical indicators have become more
positive already. Its own economy watchers index has stopped its
decline but is still weak. Machinery orders have picked up. And, the
OECD composite leading indicators show that Japan’s index is making a
turn for the better after experiencing the worst slump among OECD
member countries so far in this cycle. But the US leading indicator is
weakening and the US remains an important export market for Japan.
| Japan GDP | ||||||||||
|---|---|---|---|---|---|---|---|---|---|---|
| Consumption | Capital Formation |
Trade Domestic |
||||||||
| GDP | Private | Public | Gross Fixed Capital |
Plant& Eqpt |
Housing | Exp Imp |
Exports | Imports | Demand | |
| % change Q/Q at annual rates of change; X-M is Q/Q change in Bil of Real Yen | ||||||||||
| Q4-07 | 3.5% | 0.9% | 3.6% | -0.1% | 8.1% | -32.3% | 2.4 | 13.2% | 2.2% | 1.6% |
| Q3-07 | 1.2% | 0.6% | 0.6% | -3.9% | 3.7% | -29.4% | 2.6 | 12.2% | -0.5% | -0.9% |
| Q2-07 | -1.5% | 0.6% | 1.2% | -9.6% | -6.4% | -16.4% | 0.6 | 4.6% | 2.1% | -2.0% |
| Q1-07 | 3.8% | 2.5% | 0.8% | 1.5% | -1.8% | -5.0% | 2.3 | 14.8% | 4.1% | 2.1% |
| % change Yr/Yr; X-M is Yr/Yr change in Gap in Bil of Real Yen | ||||||||||
| Q4-07 | 1.7% | 1.1% | 1.6% | -3.1% | 0.8% | -21.5% | 7.9 | 11.1% | 2.0% | 0.2% |
| Q3-07 | 1.9% | 2.0% | 0.3% | -1.2% | 0.6% | -11.4% | 6.1 | 8.6% | 1.5% | 0.8% |
| Q2-07 | 1.7% | 1.0% | 0.6% | -0.6% | 0.3% | -3.0% | 5.4 | 7.9% | 1.4% | 0.6% |
| Q1-07 | 2.9% | 1.7% | 0.8% | 3.3% | 7.1% | -1.1% | 4.9 | 7.6% | 1.9% | 2.0% |
| 5-Yrs | 2.1% | 1.4% | 1.3% | 0.8% | 5.2% | -4.2% | n.a. | 9.6% | 4.2% | 1.3% |
by Robert Brusca March 12, 2008
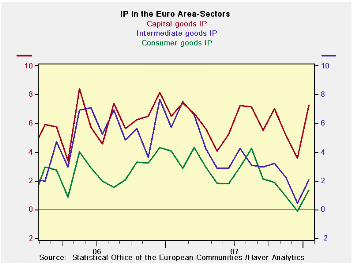
In January Euro Area IP rose by a strong 0.9%. MFG output
advanced at a 1.2% pace and even consumer goods output was strong with
a gain of 0.8%. Consumer durables output led the advance within
consumption with a rise of 1.9% in the month. But capital goods
expansion was stronger still, rising by 2.7% in January as intermediate
goods output rose by 0.8%. These figures left Yr/Yr trends strong as
MFG output rose at a 3.2% pace over 12 months and capital equipment
rose at a 7.3% pace. Yr/Yr consumer output was up by just 1.3%.
However, in the new quarter with one month’s data overall IP is
expanding at a 7.2% pace led by capital equipment which is up at a
15.5% pace. Even consumer output is rising at a strong 4.4% pace in the
new quarter.
As we saw in the country detail IP reports earlier, several
EMU nations experienced some exceptional factors that augmented growth
in January. The Bundesbank is looking for overall German growth to slow
below trend there. There is also the strong euro’s impact to consider.
While January was a stronger month it is best to be wary of what the
future holds for IP trends in the months ahead.
| E-zone and UK IP and MFG | |||||||
|---|---|---|---|---|---|---|---|
| Saar except m/m | Mo/Mo | Jan-08 | |||||
| Euro Area Detail | Jan-08 | Dec-07 | Nov-07 | 3-mo | 6-mo | 12-mo | Qtr-to-Date |
| Manufacturing | 1.2% | 0.2% | -0.4% | 3.8% | 3.1% | 3.2% | 7.2% |
| Consumer Goods | 0.8% | 0.1% | -0.5% | 1.7% | 1.5% | 1.3% | 4.4% |
| Consumer Durables | 1.9% | -0.1% | -1.9% | -0.9% | -0.8% | 0.1% | -- |
| Consumer Nondurables | 0.6% | 0.1% | -0.1% | 2.4% | 1.9% | 1.6% | -- |
| Intermediate Goods | 0.8% | 0.4% | -0.6% | 2.0% | 1.8% | 2.1% | 4.9% |
| Capital Goods | 2.7% | -0.3% | -0.1% | 9.3% | 7.3% | 7.3% | 15.5% |
by Robert Brusca March 12, 2008
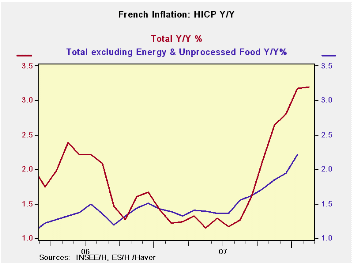
French headline inflation began to level off in February of 2008. The 12-month rate that rose to 3.2% in January from 2.8% in December held steady at that 3.2% pace in February. The ECB has a ceiling objective only for the inflation’s headline. At 3.2% France’s own pace is well above that 2% ceiling. Still it is something that year/year acceleration has stopped, for now. The core inflation reading is not available but the HICP core rate edged above the 2% mark last month.
As to the various inflation categories we can turn to France’s domestic inflation measure that has slightly different ingredients form the HICP. France’s overall inflation on that measure is up by 2.9% year/year the same as it was last month. The French domestic core inflation rate is at 2.1% in February up from 2% in January. Inflation overall, at 2.9%, is higher than it was 12 months ago (1.1%). Not surprisingly the diffusion condition based that result is high at 72.7%.
This diffusion reading is a US ISM type measure that counts all inflation accelerating categories in the CPI as a value of ‘one.’ If inflation is steady period to period it counts as 0.5. The category results are totaled and taken as a percentage of the total number of categories. Roughly this means that above 50% inflation is accelerating and below 50% inflation is decelerating. For the year ago comparison we find that inflation accelerated year/year in 72% of the categories. And that seems bad. But over six months, although the inflation rate was higher-still at a 3.6% pace, inflation diffusion was only 36%. Over three months inflation is at 3% and diffusion is at 27%. So inflation is not accelerating on a broader patch, but rather on a narrower one, if at all.
The overall inflation rate, while still high, has come down. You can see it in the core domestic French rate that is 2.1% year/year, 2.3% over 6 months and 1.9% over 3 months. Inflation is not getting out of hand in France despite the ugly headlines. Food costs are a problem, surging and steadily accelerating over the past year until those costs are up at an 8% pace over the most recent three months. In addition, energy prices have been rising and spot oil is still higher than it was in January and February on average.
Inflation is still a ‘threat’ but the detailed trends from France suggest that the ECB and the strong euro are helping to keep inflation from spreading. France has the fourth best record in EMU on keeping core inflation in check from 2000 to date. Finland has the best record, Germany the second best for that period. Greece has the worst record followed by Ireland and Spain.
| France HICP and CPI details | |||||||
|---|---|---|---|---|---|---|---|
| Mo/Mo % | Saar % | Yr/Yr | |||||
| Feb-08 | Jan-08 | Dec-07 | 3-Mo | 6-Mo | 12-Mo | Yr Ago | |
| HICP Total | 0.0% | 0.3% | 0.4% | 3.0% | 4.1% | 3.2% | 1.2% |
| Core | #N/A | 0.3% | 0.3% | #N/A | #N/A | #N/A | 1.4% |
| CPI | |||||||
| All | 0.0% | 0.4% | 0.3% | 3.0% | 3.6% | 2.9% | 1.1% |
| CPI ex Food & Energy | 0.1% | 0.2% | 0.2% | 1.9% | 2.3% | 2.1% | 1.2% |
| Food | 0.2% | 1.2% | 0.6% | 8.0% | 7.2% | 5.1% | 0.7% |
| Alcohol | 0.3% | 0.1% | 0.1% | 1.9% | 2.5% | 4.7% | 0.7% |
| Clothing & Shoes | -0.2% | -0.7% | 0.1% | -2.8% | -0.8% | 0.6% | 0.8% |
| Rent &Utilities | 0.2% | 0.5% | 0.6% | 4.9% | 6.7% | 4.6% | 3.3% |
| Health Care | 0.0% | 0.1% | -0.1% | 0.2% | 0.3% | 0.3% | 0.2% |
| Transport | 0.1% | 0.1% | 1.0% | 5.1% | 8.2% | 5.8% | 1.0% |
| Communication | -1.4% | -0.4% | -0.3% | -8.0% | -3.1% | -2.1% | -1.8% |
| Recreation & Culture | -0.2% | 0.0% | -0.3% | -2.1% | -1.7% | -1.3% | -2.0% |
| Education | 0.2% | 0.5% | 0.2% | 3.6% | 3.6% | 3.0% | 2.5% |
| Restaurant & Hotel | 0.2% | 0.4% | 0.3% | 3.3% | 0.8% | 2.8% | 2.5% |
| Other | 0.0% | 0.0% | 0.2% | 0.7% | 1.6% | 1.8% | 2.4% |
| Diffusion Type | 27.3% | 36.4% | 72.7% | ||||
| Compared to | 6-mo | 12-mo | Yr-Ago | ||||

Tom Moeller
AuthorMore in Author Profile »Prior to joining Haver Analytics in 2000, Mr. Moeller worked as the Economist at Chancellor Capital Management from 1985 to 1999. There, he developed comprehensive economic forecasts and interpreted economic data for equity and fixed income portfolio managers. Also at Chancellor, Mr. Moeller worked as an equity analyst and was responsible for researching and rating companies in the economically sensitive automobile and housing industries for investment in Chancellor’s equity portfolio. Prior to joining Chancellor, Mr. Moeller was an Economist at Citibank from 1979 to 1984. He also analyzed pricing behavior in the metals industry for the Council on Wage and Price Stability in Washington, D.C. In 1999, Mr. Moeller received the award for most accurate forecast from the Forecasters' Club of New York. From 1990 to 1992 he was President of the New York Association for Business Economists. Mr. Moeller earned an M.B.A. in Finance from Fordham University, where he graduated in 1987. He holds a Bachelor of Arts in Economics from George Washington University.
More Economy in Brief


