 Global| Oct 22 2008
U.S. Mortgage Applications Lowest Since 2000
by:Tom Moeller
|in:Economy in Brief
Summary
The total number of mortgage applications fell 16.6% last week from the prior period to their lowest level since late-2000, according to the Mortgage Bankers Association. The decline pulled the October average 17.6% below September [...]
The total number of mortgage applications fell 16.6% last week from the prior period to their lowest level since late-2000, according to the Mortgage Bankers Association. The decline pulled the October average 17.6% below September during which there had been a brief upturn in applications.
Applications for a mortgage to purchase a home tumbled 10.9% w/w and the decline pulled the month-to-date average 13.5% below September. Last month, purchase applications rose 8.7% from August during which these applications fell 6.1% m/m (-27.0% y/y). The August decline was accompanied by a 2.4% m/m decline (-12.7% y/y) in new plus existing single family home sales.
During the last ten years there has been a 61% correlation
between the y/y change in purchase applications and the change in new
plus existing single family home sales. Figures covering sales of
existing single-family home will be available this Friday while
single-family home sales will be published early next week.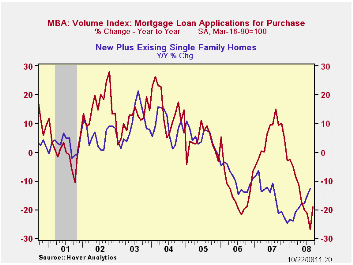
Applications to refinance a home mortgage tumbled 23.5% last week and the decline lowered applications so far this month 22.3% below the September average. During September, applications to refinance had risen 61.9% from August as 15-year mortgage rates fell briefly to 5.54%.
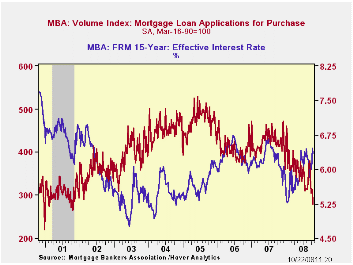
The effective interest rate on a conventional 15-year mortgage rose last week to 6.33% following an average of 6.01% last month. For a 30-year mortgage, rates fell w/w to 6.50%. Interest rates on 15 and 30 year mortgages are closely correlated (>90%) with the rate on 10-year Treasury securities. For an adjustable rate 1-Year mortgage the rate rose to 7.07% from 6.70% averaged last month.
During the last ten years there has been a (negative) 79% correlation between the level of applications for purchase and the effective interest rate on a 30-year mortgage.
The Mortgage Bankers Association surveys between 20 to 35 of the top lenders in the U.S. housing industry to derive its refinance, purchase and market indexes. The weekly survey covers roughly 50% of all U.S. residential mortgage applications processed each week by mortgage banks, commercial banks and thrifts. Visit the Mortgage Bankers Association site here.
The figures for weekly mortgage applications are available in Haver's USWEEKLY database.
Strategic Risk Management in an Interconnected World is the title of a speech given Monday by Fed Governor Randall S. Kroszner and it can be found here.
Unprecedented Times in our Economy* are
remarks offered last week by Chicago Fed President Charles L. Evans and
they are available here.
| BA Mortgage Applications (3/16/90=100) | 10/17/08 | 10/10/08 | Y/Y | 2007 | 2006 | 2005 |
|---|---|---|---|---|---|---|
| Total Market Index | 408.1 | 489.3 | -37.8% | 652.6 | 584.2 | 708.6 |
| Purchase | 279.3 | 313.5 | -32.8% | 424.9 | 406.9 | 470.9 |
| Refinancing | 1,158.8 | 1,514.2 | -43.7% | 1,997.9 | 1,634.0 | 2,092.3 |
by Robert Brusca October 22, 2008
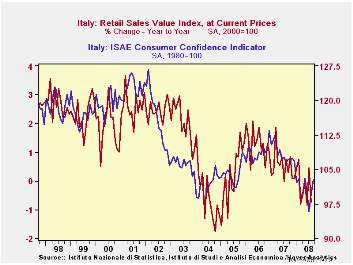
Italy’s consumer sentiment trend and retail sales trends
continue to show each other the way lower. While some speak
disparagingly about consumer surveys, it is clear that the consumer’s
habits are bang in line with what the consumer is telling various
surveyors.
In the quarter to date (two-months into Q3), nominal sales are
still rising. But on the more important inflation-adjusted basis sales
are dropping at a -3.4% annual rate - that’s quite weak.
Nominal sales trends have bee negative over three, six and
twelve month horizons. In August weakness seems to have hit all the
major categories together. While July showed a nominal sales gain, it
is now clear that it was not heralding a period of better growth ahead
That much has become clear in August.
Italy remains a trouble EMU economy, led by consumer sector
weakness.
| Italy Retail Sales Growth | ||||||||
|---|---|---|---|---|---|---|---|---|
| mo/mo % | At annual rates | |||||||
| Nominal | Aug-08 | Jul-08 | Jun-08 | 3-MO | 6-MO | 12-MO | YrAgo | Q-2-Date |
| Retail Trade | -0.5% | 0.6% | -0.4% | -1.1% | -1.5% | -0.7% | 0.7% | 0.9% |
| Food Bev & Tobacco | -0.3% | 0.6% | -0.1% | 1.0% | 0.3% | 0.9% | 1.5% | 2.4% |
| Clothing&Furniture | -6.1% | 6.3% | -3.0% | -12.2% | -10.7% | -3.7% | -0.3% | 12.8% |
| Total Real Retail | -0.7% | 0.3% | -0.9% | -5.1% | -5.4% | -4.6% | -0.9% | -3.4% |
| Real | ||||||||
| Retial Ex auto | -0.7% | 0.3% | -0.9% | -5.1% | -5.4% | -4.6% | -0.9% | |

Tom Moeller
AuthorMore in Author Profile »Prior to joining Haver Analytics in 2000, Mr. Moeller worked as the Economist at Chancellor Capital Management from 1985 to 1999. There, he developed comprehensive economic forecasts and interpreted economic data for equity and fixed income portfolio managers. Also at Chancellor, Mr. Moeller worked as an equity analyst and was responsible for researching and rating companies in the economically sensitive automobile and housing industries for investment in Chancellor’s equity portfolio. Prior to joining Chancellor, Mr. Moeller was an Economist at Citibank from 1979 to 1984. He also analyzed pricing behavior in the metals industry for the Council on Wage and Price Stability in Washington, D.C. In 1999, Mr. Moeller received the award for most accurate forecast from the Forecasters' Club of New York. From 1990 to 1992 he was President of the New York Association for Business Economists. Mr. Moeller earned an M.B.A. in Finance from Fordham University, where he graduated in 1987. He holds a Bachelor of Arts in Economics from George Washington University.
More Economy in Brief


