 Global| Jul 11 2008
U.S. May Trade Deficit Narrowed Unexpectedly
by:Tom Moeller
|in:Economy in Brief
Summary
The U.S. foreign trade deficit unexpectedly narrowed in May to $59.8B from a little-revised $60.5B in April. A May deficit of $62.4B had been generally expected. So far this year the monthly deficit has averaged $59.0B versus $59.8B [...]
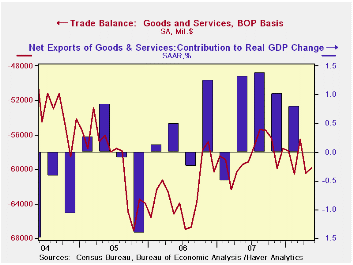
The U.S. foreign trade deficit unexpectedly narrowed in May to $59.8B from a little-revised $60.5B in April. A May deficit of $62.4B had been generally expected. So far this year the monthly deficit has averaged $59.0B versus $59.8B during the first five months of 2007.
In constant dollars the picture is even more encouraging as
the deficit narrowed to $43.6B from $46.6B in April. So far this year
the real deficit has narrowed by $10B to an average $47.8B. For the
second quarter so far it appears the narrower deficit will add up to
two percentage points to real GDP growth after additions between 0.8
and 1.4 percentage points during the last three quarters.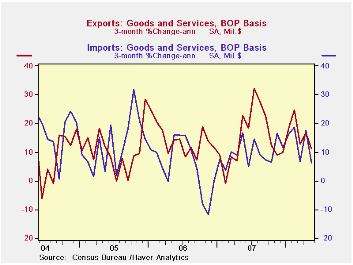
U.S. exports rose 0.9% following the 3.7% pop in April that was revised up slightly. Annualized, exports have risen at an 11.4% rate during the last three months versus 13.0% growth during 2006 and 2007.
Goods exports rose 0.5% May after an upwardly revised 5.0% pop in April. In chained dollars they rose 0.7% (10.3% y/y). Real exports of nonauto consumer goods dipped 0.1% (+10.4% y/y) after their 6.2% pop during April. Exports of capital goods also gave back some of their strong April gain and fell 1.7% (+6.8% y/y). Exports of industrial supplies & materials jumped 4.8% during May (16.0% y/y).
Exports of services rose 1.3% (16.0% y/y), about the same as they did during April. Travel exports surged 2.3% (20.0% y/y) and passenger fares rose 0.8% (25.9% y/y).
Reduced demand for oil dropped May petroleum imports by 1.7%. Adjusted for the higher prices, petroleum imports slouched by 10.5% (-13.5% y/y). The average cost for a barrel of crude oil was $106.28 in May.
Month-to-month, imports of nonpetroleum products rose 1.3% but
measured in chained 2000 dollars these imports rose just 0.8% (0.8%
y/y) following a 2.5% surge in April. In chained dollars imports of
capital goods surged again by 1.6% (6.3% y/y). Chained imports of
nonauto consumer goods also were quite firm and jumped 3.6% (2.2% y/y).
That strength was countered by a 3.9% (-3.1% y/y) drop in real imports
of automotive vehicles & parts.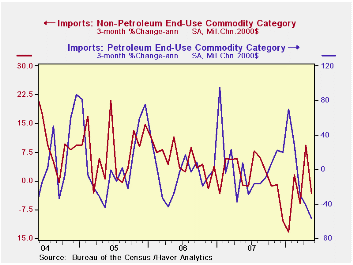
Services imports jumped 1.1% (8.9% y/y). Travel imports increased reversed an April decline and rose 1.4% (8.2% y/y) while passenger fares increased 1.3% (16.5% y/y).
With China, the U.S. trade deficit in goods added to the sharp April deterioration and fell to $21.0B. That was the deepest deficit since last November. The deficit with China during the first five months of this year is about the same as during last year's first five months. Exports to China rose 26.3% y/y and imports rose a moderate 9.4%.
Globalization and Inflation Dynamics: The Impact of Increased Competition from the Federal Reserve Bank of New York is available here
Building a Better World: Infrastructure's Role in Economic Growth from the Federal Reserve Bank of Atlanta can be found here
| Foreign Trade | May | April | Y/Y | 2007 | 2006 | 2005 |
|---|---|---|---|---|---|---|
| U.S. Trade Deficit | $59.8B | $60.5B | $59.4B (5/07) | $700.3 | $753.3 | $711.6B |
| Exports - Goods & Services | 0.9% | 3.7% | 17.8% | 13.0% | 13.5% | 10.6% |
| Imports - Goods & Services | 0.3% | 4.6% | 12.5% | 6.1% | 10.8% | 12.8% |
| Petroleum | -1.7% | 12.9% | 47.4% | 9.4% | 20.1% | 39.6% |
| Nonpetroleum Goods | 1.3% | 3.7% | 6.9% | 4.8% | 9.1% | 10.3% |
by Tom Moeller July 11, 2008
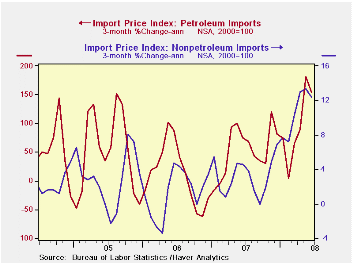
U.S. import price overall jumped another 2.6% last month. That was little changed from the gains in each of the prior three months and it exceeded the expected 2.0% increase. During the last three months import prices have risen at a 37.6% annual rate which was near the quickest since late-1990.
The rise was led by the strength in petroleum prices which jumped another 7.4% and the three-month rate of increase amounted to 154%. Imported crude petroleum prices in July are about even with June .
Less petroleum, import prices rose 0.9% after a 0.7% gain during May, again pushed higher by the lower foreign exchange value of the dollar. The 12.4% rate of price increase during the last three months is near the fastest on record.
During the last ten years there has been a 66% (negative) correlation between the nominal trade-weighted exchange value of the US dollar vs. major currencies and the y/y change in non oil import prices. The correlation is a reduced 47% against a broader basket of currencies.
Prices
for industrial supplies & materials excluding oil surged
another 3.4% in June and the three-month rate of increase ballooned to
41.0% (AR).. There has been great strength in finished metal, chemicals
and agricultural prices. The detailed import price series can be found
in the Haver USINT database. 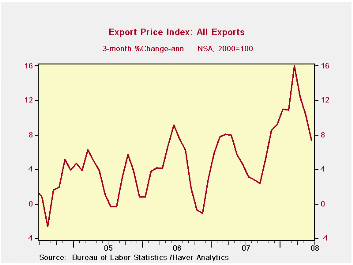
Capital goods import prices rose 0.3% and the three month rate of gain of 2.8% is double last year's rate of increase. Less the lower prices of computers, capital goods prices have been rising at an 8.0% rate during the last three months. They rose 2.7% last year. Prices of computers, peripherals and accessories have fallen at a 4.9% rate this year after the 5.1% 2007 decline.
Finally, prices for nonauto consumer goods imports rose 0.2% in June but they have risen at a 5.1% in 2008 after the 1.6% increase last year. This year's gain in prices is the quickest since 1992 and has been notable for durables (5.7%).
Total export prices surged 1.0% as agricultural prices jumped 2.2% (33.0% y/y). Nonagricultural export prices also have been strong and they rose in June by 0.9% (6.4% y/y).
What Is the Optimal Inflation Rate? from the Federal Reserve Bank of Kansas City can be found here.
| Import/Export Prices (NSA) | June | May | Y/Y | 2007 | 2006 | 2005 |
|---|---|---|---|---|---|---|
| Import - All Commodities | 2.6% | 2.6% | 20.5% | 4.2% | 4.9% | 7.5% |
| Petroleum | 7.4% | 8.9% | 78.6% | 11.6% | 20.6% | 37.6% |
| Non-petroleum | 0.9% | 0.7% | 7.3% | 2.7% | 1.7% | 2.7% |
| Export- All Commodities | 1.0% | 0.4% | 8.6% | 4.9% | 3.6% | 3.2% |
by Tom Moeller July 11, 2008
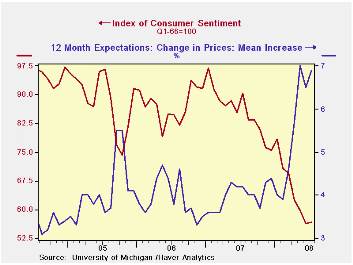
The University of Michigan's index of consumer sentiment in early July ticked up 0.4% versus the June average to a level of 56.6. The rise beat Consensus expectations for a slight decline. Nevertheless the level of sentiment remained near the lowest level since 1980.
During the last ten years there has been a 47% correlation between the level of sentiment and the three month change in real consumer spending.
The current conditions index improved 2.8% (-33.5% y/y) but that made up just a sliver of the recent monthly declines. The rise was due to a sharp increase in the index of whether now is a good time to buy large household goods to the highest level since March (-26.9% y/y). The view of current personal finances fell yet again (-44.3% y/y).
The expectations component of overall sentiment fell another
1.8% as the index fell to its lowest level since 1980. Expectations for
personal finances dropped 2.1% (-24.8% y/y) like it did during the
prior two months. It was at its lowest level since 1980 while
expectations for business conditions during the next five years
improved just slightly but remained near the lowest level since 1990.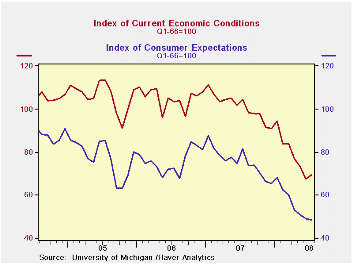
The opinion of government policy, which apparently influences economic expectations, gave back its June improvement. It was it's lowest since 1992 as only 4% of respondents had a favorable opinion of government policy and 52% thought a poor job was being done. An only fair opinion of policy was held by 42% of respondents.
The mean expected rate of inflation during the next twelve months rose back to 6.9%, about equal to its 1981 high. During the next five years the expected inflation rate slipped to 3.8%.
The University of Michigan survey is not seasonally adjusted.The reading is based on telephone interviews with about 500 households at month-end; the mid-month results are based on about 300 interviews. The summary indexes are in Haver's USECON database, with details in the proprietary UMSCA database.
Has the Behavior of Inflation and Long-Term Inflation Expectations Changed? from the Federal Reserve Bank of Kansas city is available here.
| University of Michigan | July (Prelim.) | June | May | July y/y | 2007 | 2006 | 2005 |
|---|---|---|---|---|---|---|---|
| Consumer Sentiment | 56.6 | 56.4 | 59.8 | -37.4% | 85.6 | 87.3 | 88.5 |
| Current Conditions | 69.5 | 67.6 | 73.3 | -33.5% | 101.2 | 105.1 | 105.9 |
| Expectations | 48.3 | 49.2 | 51.1 | -40.7% | 75.6 | 75.9 | 77.4 |
by Tom Moeller July 11, 2008
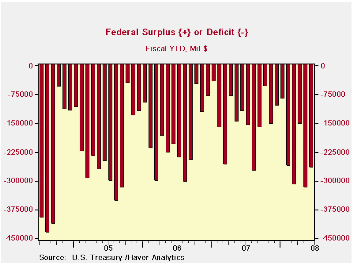
The U.S. government ran a budget surplus in June, as it usually does, of $50.7B. In fact, the surplus was double the size it was during the past several years. Based on expectations formed by Public Debt Transactions from the Daily Treasury Statement, the budget surplus beat the Consensus forecast for a $30.0B surplus. These transactions data are available in Haver's DAILY database.
That, however, is where the good news on the Federal budget front ends. For the first nine months of FY08 the government ran a budget deficit of $268.7B which was more than double the deficit during the first nine months of FY07.
For the fiscal year to date federal receipts fell 0.6% from a
year earlier, the first negative comparison since 2003 and it compared
to 7.5% y/y growth during the first nine months of FY07. Higher
unemployment pulled the growth in individual income tax receipts (44%
of total receipts) to a negative 0.8% this year versus 11.5% growth in
FY07. Growth in withheld income taxes of 4.8% was roughly half that of
a year earlier and non-withheld taxes grew 5.2%, or nearly one third as
during the first nine months of FY07.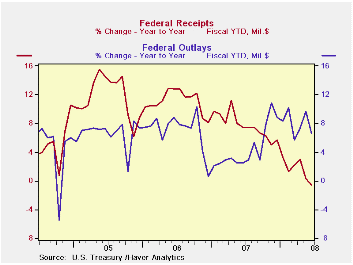
Lower corporate profitability provided a further crimp to government revenues. Corporate income taxes (13% of total receipts) declined 7.5% decline from receipts during the first nine months of FY07. During FY07 they rose 10.0% during the first nine months.
Unemployment insurance contributions fell 2.5% FYTD due to negative employment growth but Federal excise taxes rose 5.8%. Estate and gift taxes rose 13.6%.
U.S. net outlays grew 6.6% during the first nine months of FY08. That growth was more than double the outlay growth of FY07's first nine months. Growth in defense spending (19% of total outlays) led the doubling with a 10.1% gain while growth in transportation spending surged to 7.5% from 1.8% in FY07's first nine months.
Medicare expenditures (12% of outlays) actually fell 1.8% but health spending (10% of total outlays) held constant at a 5.4% growth rate. Growth in Social Security spending (21% of outlays) also held steady at 5.3% while growth in interest expense also held steady at 4.3%. Growth in outlays for income security (15% of outlays) surged to 17.5% from 4.4%.
The Government's financial data is available in Haver's USECON database.
| US Government Finance | June | May | Y/Y | FY 2007 | FY 2006 | FY 2005 |
|---|---|---|---|---|---|---|
| Budget Balance | $50.73B | -$165.9B | $27.5B (6/07) | -$162.0B | -$248.2B | -$318.7B |
| Net Revenues | $259.9 | $124.3B | -6.0% | 6.7% | 11.8% | 14.1% |
| Net Outlays | $209.2 | $290.2B | -16.0% | 2.8% | 7.4% | 7.6% |
by Robert Brusca July 11, 2008
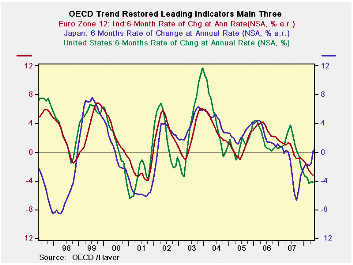
The OECD cyclically adjusted leading indicators are pointing severely lower. Japan continues to point to recovery in the LEI scheme of the OPED, yet many Japanese domestic indicators continue to unravel such as its consumer confidence report, freshly released today, a report that is up-to-date for consumer feelings through June and shows continued deterioration.
German data have been getting weaker and so have French and Italian reports. The slide in the EMU region is documented here as well as in the EMU’s own statistics.
The US signal is flattening out in the OECD framework and is
not showing as deep a decline as it did in the last US recession - but
it is a significant drop and slowdown. The OECD metrics are pointing to
a broad-based slowdown and only show good news in train for Japan where
Japan’s own domestic series do not seem to reflect the OECD’s optimism.
| OECD Trend-restored leading Indicators | ||||
|---|---|---|---|---|
| Growth progression-SAAR | ||||
| 3-Mos | 6-Mos | 12-Mos | Yr-Ago | |
| OECD | -3.9% | -2.7% | -2.6% | 1.8% |
| OECD7 | -3.0% | -3.2% | -3.3% | 1.1% |
| OECD Europe | -4.5% | -3.8% | -2.8% | 1.2% |
| OECD Japan | 1.1% | 0.9% | -2.4% | 0.0% |
| OECD US | -3.6% | -4.1% | -3.7% | 1.8% |
| Six month readings at 6-Mo Intervals: | ||||
| Recent six | 6-Mo Ago | 12-Mo Ago | 18-Mo Ago | |
| OECD | -2.7% | -2.6% | 2.6% | 1.1% |
| OECD7 | -3.2% | -3.5% | 1.8% | 0.4% |
| OECD Europe | -3.8% | -1.8% | 1.1% | 1.3% |
| OECD Japan | 0.9% | -5.7% | 0.1% | 0.0% |
| OECD US | -4.1% | -3.2% | 2.8% | 0.8% |
| Slowdowns indicated by BOLD RED | ||||

Tom Moeller
AuthorMore in Author Profile »Prior to joining Haver Analytics in 2000, Mr. Moeller worked as the Economist at Chancellor Capital Management from 1985 to 1999. There, he developed comprehensive economic forecasts and interpreted economic data for equity and fixed income portfolio managers. Also at Chancellor, Mr. Moeller worked as an equity analyst and was responsible for researching and rating companies in the economically sensitive automobile and housing industries for investment in Chancellor’s equity portfolio. Prior to joining Chancellor, Mr. Moeller was an Economist at Citibank from 1979 to 1984. He also analyzed pricing behavior in the metals industry for the Council on Wage and Price Stability in Washington, D.C. In 1999, Mr. Moeller received the award for most accurate forecast from the Forecasters' Club of New York. From 1990 to 1992 he was President of the New York Association for Business Economists. Mr. Moeller earned an M.B.A. in Finance from Fordham University, where he graduated in 1987. He holds a Bachelor of Arts in Economics from George Washington University.
More Economy in Brief


