 Global| Apr 07 2014
U.S. Long-Term Unemployment Shows An Out-Sized Decline
by:Tom Moeller
|in:Economy in Brief
Summary
Friday's report on U.S. labor market conditions showed a pickup in payroll employment growth and a stable, but low unemployment rate. Within the detail behind these observations was another sign of job market improvement: the ranks of [...]
Friday's report on U.S. labor market conditions showed a pickup in payroll employment growth and a stable, but low unemployment rate. Within the detail behind these observations was another sign of job market improvement: the ranks of those unemployed for the longest periods of time are thinning at the greatest rate.
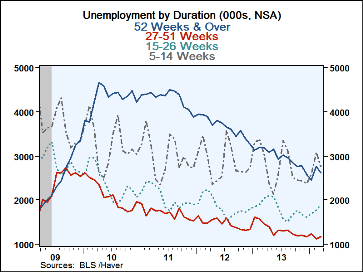
The unemployment rate held steady last month at 6.7%, where it's been during three of the last four months. It was down from 7.5% twelve months earlier and was at the lowest level since October 2008. Overall unemployment during the last twelve months fell 10.8%. Leading the way lower was a 19.6% y/y drop in the number of workers out of work for 27-51 weeks. The ranks of the even longer-term unemployed fell 18.0% y/y. These double-digit rates of decline continue the strong down-trend in place since 2012. The number of shorter-term unemployed were down single digits or negligibly during the last twelve months.
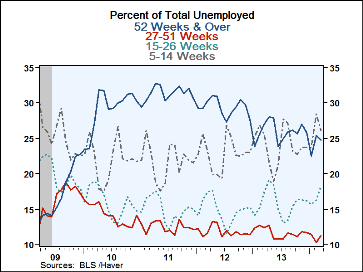
The declines in unemployment by duration have been accompanied by moderate change in the respective jobless percentages. The percentage of those unemployed for more than a year now account for a lesser 24.8% of the total versus 31.4% during the peak year of 2011. The percentage of those unemployed 27-51 weeks similarly fell to 11.2% from 12.4% in 2011. Relatively stable at 19.6% has been the percentage of those unemployed for less than 5 weeks. Higher rates of short-term unemployment balanced these declines. The percentage of those who were unemployed for 15-26 weeks rose to 18.2% of the total from 15.0% at the low and the percentage of those unemployed 5-14 weeks gained to 26.2% from 21.7% in 2011.
These figures from the U.S. Bureau of Labor Statistics are available in Haver's EMPL database.
| Unemployment by Duration (NSA) | Mar | Feb | Jan | Y/Y | 2013 | 2012 | 2011 |
|---|---|---|---|---|---|---|---|
| Total Number of Unemployed Workers (000s) | 10,537 | 10,893 | 10,855 | -10.8% | -8.4% | -9.0% | -7.3% |
| Unemployed 52 Weeks & Over | 2,616 | 2,762 | 2,452 | -18.0 | -18.9 | -14.9 | 0.2 |
| Unemployed 27-51 Weeks | 1,180 | 1,124 | 1,238 | -19.6 | -9.1 | -13.9 | -19.3 |
| Unemployed 15-26 Weeks | 1,913 | 1,771 | 1,702 | -6.7 | -2.8 | -9.8 | -13.1 |
| Unemployed 5-14 Weeks | 2,766 | 3,091 | 2,587 | -9.0 | -3.8 | -4.2 | -8.4 |
| Unemployed Less Than 5 Weeks | 2,064 | 2,145 | 2,876 | -0.1 | -2.3 | -1.3 | -3.4 |
| Percent of Total Unemployed | |||||||
| 52 Weeks & Over | 24.8 | 25.4 | 22.6 | 27.0 | 26.0 | 29.3 | 31.4 |
| 27-51 Weeks | 11.2 | 10.3 | 11.4 | 12.4 | 11.7 | 11.8 | 12.4 |
| 15-26 Weeks | 18.2 | 16.3 | 15.7 | 17.4 | 15.8 | 14.9 | 15.0 |
| 5-14 Weeks | 26.2 | 28.4 | 23.8 | 25.7 | 24.0 | 22.9 | 21.7 |
| Less Than 5 Weeks | 19.6 | 19.7 | 26.5 | 17.5 | 22.5 | 21.1 | 19.4 |
Tom Moeller
AuthorMore in Author Profile »Prior to joining Haver Analytics in 2000, Mr. Moeller worked as the Economist at Chancellor Capital Management from 1985 to 1999. There, he developed comprehensive economic forecasts and interpreted economic data for equity and fixed income portfolio managers. Also at Chancellor, Mr. Moeller worked as an equity analyst and was responsible for researching and rating companies in the economically sensitive automobile and housing industries for investment in Chancellor’s equity portfolio. Prior to joining Chancellor, Mr. Moeller was an Economist at Citibank from 1979 to 1984. He also analyzed pricing behavior in the metals industry for the Council on Wage and Price Stability in Washington, D.C. In 1999, Mr. Moeller received the award for most accurate forecast from the Forecasters' Club of New York. From 1990 to 1992 he was President of the New York Association for Business Economists. Mr. Moeller earned an M.B.A. in Finance from Fordham University, where he graduated in 1987. He holds a Bachelor of Arts in Economics from George Washington University.
More Economy in Brief
 Global| Feb 05 2026
Charts of the Week: Balanced Policy, Resilient Data and AI Narratives
by:Andrew Cates


