 Global| Apr 04 2006
U.S. Light Vehicle Sales Soft
by:Tom Moeller
|in:Economy in Brief
Summary
US light vehicle sales during March dipped 0.1% m/m to 16.59M units according to the Autodata Corporation and were slightly softer than Consensus expectations for sales of 16.7M. Sales of US made vehicles were weak and posted a 1.4% [...]
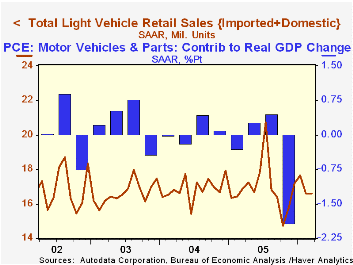
US light vehicle sales during March dipped 0.1% m/m to 16.59M units according to the Autodata Corporation and were slightly softer than Consensus expectations for sales of 16.7M.
Sales of US made vehicles were weak and posted a 1.4% (-4.2% y/y) decline to 12.94M units. Domestic car sales led the decline with a 2.6% (-6.8% y/y) drop while sales of domestic trucks slipped 0.6% (-2.4% y/y).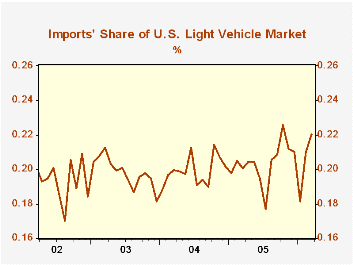
Imported light vehicle sales posted a 4.7% m/m increase (8.2% y/y) to 3.66M as car sales in March rose 6.7% (5.5% y/y) to 2.31M units. Imported truck sales also rose but by a lesser 1.6% (13.1% y/y) to a record high of 1.35M units.
Imports' share of the US light vehicle market surged to a record 22.0%. For the first three months of this year imports' share averaged 20.4% versus 20.3% during all of last year.
Increasing Global Competition and Labor Productivity: Lessons from the U.S. Automotive Industry from the Federal Reserve Bank of San Francisco can be found here.
| Light Vehicle Sales (SAAR, Mil. Units) | Mar | Feb | Y/Y | 2005 | 2004 | 2003 |
|---|---|---|---|---|---|---|
| Total | 16.59 | 16.61 | -1.7% | 16.92 | 16.87 | 16.63 |
| Autos | 7.42 | 7.41 | -3.3% | 7.65 | 7.49 | 7.62 |
| Trucks | 9.17 | 9.20 | -0.4% | 9.27 | 9.37 | 9.01 |
by Tom Moeller April 4, 2006
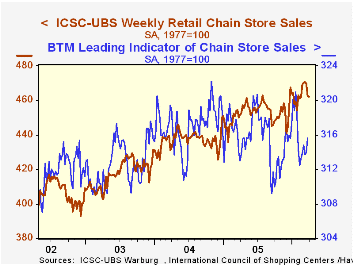
Chain store sales tread water last week, according to the International Council of Shopping Centers (ICSC)-UBS survey.The unchanged w/w level of sales followed three consecutive periods of decline.
Sales began April 1.4% lower than at the start of March but the average level of sales last month did rise 0.7% versus February.
During the last ten years there has been a 47% correlation between the y/y change in chain store sales and the change in nonauto retail sales less gasoline.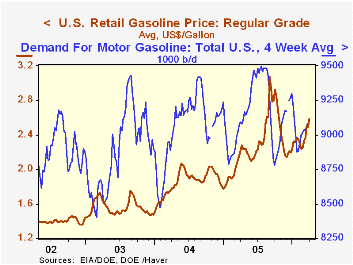
The ICSC-UBS retail chain-store sales index is constructed using the same-store sales (stores open for one year) reported by 78 stores of seven retailers: Dayton Hudson, Federated, Kmart, May, J.C. Penney, Sears and Wal-Mart.
Retail gasoline prices opened April with a nine cent w/w increase to $2.59 per gallon (16.7% y/y). In yesterday's spot market trading the price for regular unleaded gasoline of $1.92 per gallon was up another two cents from last week's average.The strength in gasoline prices has been helped by growing U.S. gasoline demand which rose 3.3% last month from the February average and 0.3% y/y.
| ICSC-UBS (SA, 1977=100) | 04/01/06 | 03/25/06 | Y/Y | 2005 | 2004 | 2003 |
|---|---|---|---|---|---|---|
| Total Weekly Chain Store Sales | 462.3 | 462.4 | 2.4% | 3.6% | 4.7% | 2.9% |
by Tom Moeller April 4, 2006
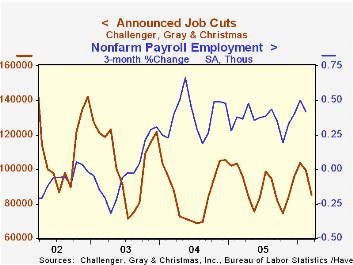
Announced job cuts fell another 25.7% m/m during March on top of the 15.5% February decline, according to the Challenger, Grey & Christmas survey. The decline was to the lowest level in nearly one year
During the last ten years there has been an 83% (inverse) correlation between the three month moving average level of announced job cuts and the three month change payroll employment.
Layoffs in the auto industry dropped sharply for the second month after the January surge but the three month average remained quite elevated. Cuts in financial (-21.7 y/y, electronics (-37.7% y/y) and government (-72.0% y/y) also fell sharply. Announced job cuts in the apparel and chemical industries, however, surged.
Job cut announcements differ from layoffs. Many are achieved through attrition, early retirement or just never occur.
Challenger also reported an increase in announced hiring plans (31.7% y/y) after three months of decline.
| Challenger, Gray & Christmas | Mar | Feb | Y/Y | 2005 | 2004 | 2003 |
|---|---|---|---|---|---|---|
| Announced Job Cuts | 64,975 | 87,437 | -24.8% | 1,072,054 | 1,039,935 | 1,236,426 |
by Louise Curley April 4, 2006
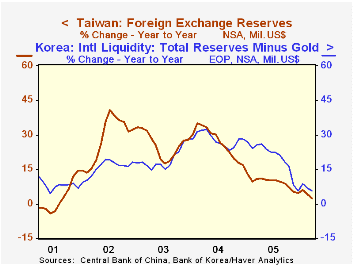
The accumulation of foreign reserves by the developing countries in the Far East appears to be decelerating. Reserves are still increasing, but much more slowly than the pace of early 2004 when the year-to-year increases in reserves were of the order of 30-50%. Taiwan and South Korea are the latest countries to report. Total foreign reserves in Taiwan were unchanged in March from February and only 2.4% above March 2005, down from year-to-year increases of 35% in early 2004. Total reserves in South Korea were up less than one percent from February and less than 6% from March 2005, compared to year-to-year increases of over 30% in early 2004. The year-to-year increases in reserves in Taiwan and South Korea are shown in the first chart.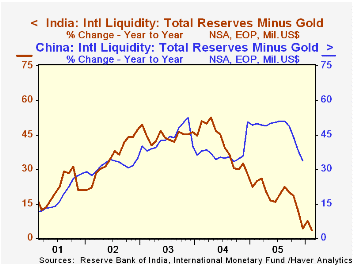
China is much slower to report its reserve holdings. The latest data are for December, but even here a deceleration can be detected. In December the year-over-year increase in reserves was down to 33.7% from 51.1% in August. 2005. The deceleration has been going on longer in India where the year-to-year increase in reserves was 11.5% in February, 2006, down from 52.5% in April, 2004. The year-to-year increases in the reserves of China and India are shown in the second chart.
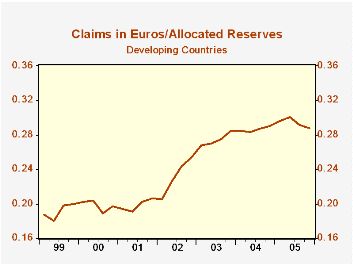
The International Monetary Fund has recently published information on the composition of total reserves and those held by the industrial countries and developing countries. Data are available in US Dollars, Euros, Pounds Sterling, Japanese Yen, Swiss Francs and a miscellaneous category "other currencies". (These data are found in the IFS data base.) The data, however, show only the composition of allocated reserves, which, in the case of the developing countries, is only slightly more than half the total. Nevertheless, the changing composition of these allocated reserves gives some indication of the broader shifts that may be taking place in total reserves. Over the period from the first quarter of 1999 when the data began to the fourth quarter of 2005, the proportion of euro claims in the allocated reserves of the developing countries rose from 19% to 29% while the proportion of US$ claims declined from 70% to 60%. (See the third and fourth charts.)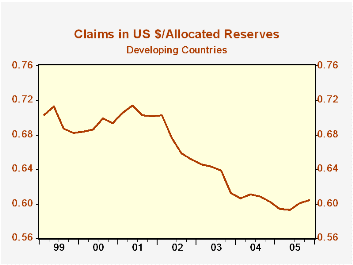
| International Reserves: Developing Countries in the Far East (Bil US$) |
Mar 06 | Feb 06 | Jan 06 | Dec 05 | Y/Y % Current | Y/Y % Past Peak | 2004 |
|---|---|---|---|---|---|---|---|
| South Korea | 217.3 | 215.9 | 216.9 | 210.3 | 5.8 | 32.4 | April |
| Taiwan | 257.0 | 257.0 | 257.3 | 253.3 | 2.4 | 35.2 | February |
| China | 821.5 | 33.7 | 51.1 | August | |||
| India | 135.9 | 134.7 | 131.9 | 11.5 | 52.5 | April |

Tom Moeller
AuthorMore in Author Profile »Prior to joining Haver Analytics in 2000, Mr. Moeller worked as the Economist at Chancellor Capital Management from 1985 to 1999. There, he developed comprehensive economic forecasts and interpreted economic data for equity and fixed income portfolio managers. Also at Chancellor, Mr. Moeller worked as an equity analyst and was responsible for researching and rating companies in the economically sensitive automobile and housing industries for investment in Chancellor’s equity portfolio. Prior to joining Chancellor, Mr. Moeller was an Economist at Citibank from 1979 to 1984. He also analyzed pricing behavior in the metals industry for the Council on Wage and Price Stability in Washington, D.C. In 1999, Mr. Moeller received the award for most accurate forecast from the Forecasters' Club of New York. From 1990 to 1992 he was President of the New York Association for Business Economists. Mr. Moeller earned an M.B.A. in Finance from Fordham University, where he graduated in 1987. He holds a Bachelor of Arts in Economics from George Washington University.


