 Global| Nov 04 2002
U.S. Light Vehicle Sales Plummet
by:Tom Moeller
|in:Economy in Brief
Summary
Unit sales of light vehicles fell in October to the lowest pace since December 2000. Consensus expectations had been for a 16.4 M sales rate. Year to date sales have averaged 16.7 M units, about equal to the first ten months of 2001. [...]
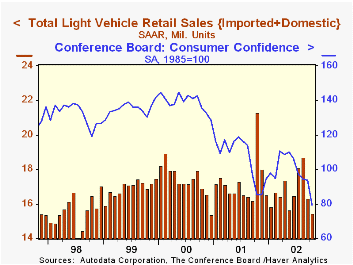
Unit sales of light vehicles fell in October to the lowest pace since December 2000. Consensus expectations had been for a 16.4 M sales rate. Year to date sales have averaged 16.7 M units, about equal to the first ten months of 2001.
Sales of domestically built vehicles fell 3.4% m/m following the 16.3% decline in September. Auto and light truck sales fell evenly.
Imported vehicle sales fell a sharper 12.9% vs. September after a 5.7% rise during that month. Imported auto sales fell 16.5% and truck sales were down 4.7%.
Imports' share of the US light vehicle market fell to 18.9% following the surge to 20.6% in September. Imports' share averaged 17.8% last year.
| Light Vehicle Sales (SAAR, Mil.Units) | Oct | Sept | Y/Y | 2001 | 2000 | 1999 |
|---|---|---|---|---|---|---|
| Total | 15.45 | 16.33 | -27.4% | 17.27 | 17.40 | 16.95 |
| Domestic | 12.53 | 12.97 | -29.3% | 14.20 | 14.58 | 14.47 |
| Imported | 2.92 | 3.36 | -17.8% | 3.07 | 2.82 | 2.48 |
by Tom Moeller November 4, 2002
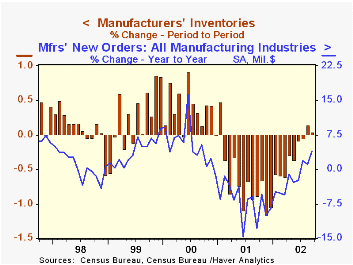
Manufacturing inventories were unchanged in September after rising slightly in August versus the initial report of a slight decline. During the last four months, factory inventories have been about flat.
Excluding the transportation sector inventories rose slightly for the third straight month and are up 0.6% during that period. The decline in transportation sector inventories was led by lower inventories of light trucks and nondefense aircraft. Factory inventories of automobiles rose sharply.
Increases in inventories have been led by the nondurable goods sector, up 2.0% during the last four months. Gains have been strong for petroleum, textile products, plastics and basic chemicals.
Decumulation in the durable goods sector continued unabated, down 0.3% m/m and 4.4% YTD. Declines have been widespread amongst industries.
Shipments fell 0.1% but for the year have risen 2.3%. Again, gains have been strongest in nondurable goods industries (3.0% YTD), notably petroleum. Less petroleum, nondurable shipments were up 1.7% YTD in September. Shipments of durable goods were up 1.7% YTD.
Factory orders fell 2.3% led by a 4.9% drop in orders for durable goods, revised from the advance report of a 5.9% decline. The decline in nondefense capital goods was lessened to -10.6% from -12.6%. Excluding aircraft the decline in capital goods orders was revised to -4.3% from -6.6%.
| Inventories | Sept | Aug | Y/Y | 2001 | 2000 | 1999 |
|---|---|---|---|---|---|---|
| Mfg Inventories | 0.0% | 0.1% | -5.2% | -8.0% | 4.5% | 3.1% |

Tom Moeller
AuthorMore in Author Profile »Prior to joining Haver Analytics in 2000, Mr. Moeller worked as the Economist at Chancellor Capital Management from 1985 to 1999. There, he developed comprehensive economic forecasts and interpreted economic data for equity and fixed income portfolio managers. Also at Chancellor, Mr. Moeller worked as an equity analyst and was responsible for researching and rating companies in the economically sensitive automobile and housing industries for investment in Chancellor’s equity portfolio. Prior to joining Chancellor, Mr. Moeller was an Economist at Citibank from 1979 to 1984. He also analyzed pricing behavior in the metals industry for the Council on Wage and Price Stability in Washington, D.C. In 1999, Mr. Moeller received the award for most accurate forecast from the Forecasters' Club of New York. From 1990 to 1992 he was President of the New York Association for Business Economists. Mr. Moeller earned an M.B.A. in Finance from Fordham University, where he graduated in 1987. He holds a Bachelor of Arts in Economics from George Washington University.
More Economy in Brief


