 Global| Jan 06 2009
U.S. Light Vehicle Sales Inched Upin December; Down 18.5% For The Full Year
by:Tom Moeller
|in:Economy in Brief
Summary
U.S. sales of light vehicles inched slightly higher last month but not by enough to prevent the twelve-month sales average from falling 18.5% to 13.18M, their lowest since 1993 according to the Autodata Corporation and Ward's [...]
U.S. sales of light vehicles inched slightly higher last month but not by enough to prevent the twelve-month sales average from falling 18.5% to 13.18M, their lowest since 1993 according to the Autodata Corporation and Ward's Automotive News. (Seasonal adjustment of the figures is provided by the U.S. Bureau of Economic Analysis). The December-to-December figures were even bleaker. The 35.5% decline dropped sales to 10.32M, their lowest level since the recession year of 1982. The level of sales for December vehicle purchases was slightly better than Consensus expectations for sales of 10.0M.
Sales of domestically-made light vehicles
edged 2.4% higher to 7.68M units and that recouped the November drop.
Nevertheless, domestic vehicle sales are off 35.3% December-to-December
and they fell 20.2% for the full year to their lowest since 1983.
Continuing to show the effects from higher gasoline prices, sales of
domestically made light trucks gave back most of their November gain to
end the year down 39.6% December-to-December. They were down by one
quarter for the full year. Doing a little better, sales of U.S. made
cars recovered their November decline and rose 10.6%. That was not
enough, however, to make up past declines. For the full year, sales of
domestically made cars fell 12.7% to 4.42M units and that was down
41.3% from the peak during 1996.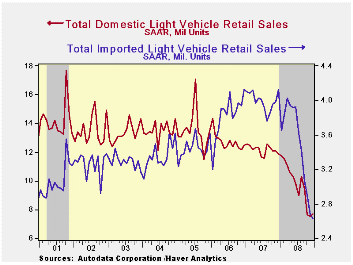
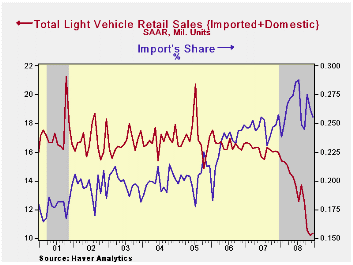
Sales of imported light vehicles continued to reflect economic recession in the U.S. and they fell 1.3% last month. The 36.0% y/y decline pulled sales for the full year down 13.2%, the first full year decline since 1996. The latest was the lowest level since December 1999.Sales of imported light vehicles fell another 5.0% (-38.4% y/y) to 1.62M units and they were down 9.1% for the full year.Sales of imported light trucks rose 5.2% (-31.8% y/y) but they were off 20.1% for 2008. For last year, imported car sales fell 9.1% from 2007 but at 2.29M they still were up 79.7% from the low in 1996.
Import's share of the U.S. light vehicle market fell slightly to 25.5% of the U.S. vehicle market in December. Nevertheless, imports' share rose to a high of 26.3% for the year. (Imported vehicles are those produced outside the U.S. and do not include vehicles with the nameplate of a foreign manufacturer produced within the U.S.)
| Light Vehicle Sales (SAAR, Mil. Units) | December | November | Dec. / Dec. | 2008 | 2007 | 2006 |
|---|---|---|---|---|---|---|
| Total | 10.32 | 10.18 | -35.5% | 13.18 | 16.16 | 16.54 |
| Autos | 5.21 | 4.95 | -32.6 | 6.71 | 7.58 | 7.77 |
| Domestic | 3.59 | 3.24 | -29.5 | 4.42 | 5.07 | 5.31 |
| Imported | 1.62 | 1.71 | -38.4 | 2.29 | 2.52 | 2.45 |
| Light Trucks | 5.11 | 5.23 | -38.2 | 6.47 | 8.60 | 8.78 |
| Domestic | 4.10 | 4.26 | -39.6 | 5.29 | 7.10 | 7.42 |
| Imported | 1.02 | 0.97 | -31.8 | 1.18 | 1.47 | 1.37 |
| December 2008 (Y/Y, %) | Market Share, Cars (%) | Market Share, Trucks (%) | |
|---|---|---|---|
| General Motors | -24.9 | 16 | 25 |
| Ford | -29.4 | 11 | 22 |
| Chrysler | -59.2 | 6 | 17 |
| Toyota | -34.8 | 21 | 14 |
| Honda | -30.4 | 13 | 8 |
| Nissan | -26.8 | 8 | 5 |
| Volkswagen | -20.1 | 5 | 1 |
Europe's Services PMI At New Low
by Robert Brusca January 6, 2009
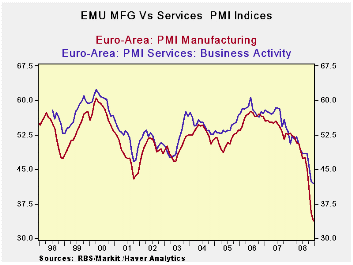
The services PMI index for Europe fell to 42.06 from 42.47.
All main reporting EMU members show very weak service sector indices.
France is at an all time low (the data above date from May 2000 a
period for which all these countries have observations). The EMU result
is a ten year low.
Weakness continues to be the order of the day across Europe.
The chart at the top shows that the MFG and services PMI’s both are
dropping sharply, although the pace of decline in services hints at a
slowdown in the unraveling.
The new wrinkle is the potential impact on Europe as gas
availability from the Russian pipeline is being curtailed stemming from
a dispute between Russia and the Ukraine. European nations are
suffering to various degrees but smaller countries with leaner
stockpiles are the most at risk. There is no sense yet that much
activity has been curtailed because of the light natural gas
deliveries, but an adverse economic impact remains a possibility if the
deliveries continue to be short or cut off entirely.
| NTC Services Indices for EU/EMU | |||||||
|---|---|---|---|---|---|---|---|
| Dec-08 | Nov-08 | Oct-08 | 3Mo | 6Mo | 12Mo | Percentile | |
| Euro-13 | 42.06 | 42.47 | 45.76 | 43.43 | 45.92 | 48.47 | 0.0% |
| Germany | 46.57 | 45.14 | 48.31 | 46.67 | 49.13 | 50.73 | 18.5% |
| France | 40.57 | 46.17 | 47.54 | 44.76 | 46.65 | 50.44 | 0.0% |
| Italy | 40.30 | 39.46 | 45.68 | 41.81 | 44.82 | 46.59 | 3.6% |
| Spain | 32.10 | 28.23 | 32.22 | 30.85 | 34.12 | 38.20 | 11.9% |
| Ireland | 34.14 | 32.60 | 36.05 | 34.26 | 37.47 | 42.01 | 4.3% |
| EU only | |||||||
| UK (CIPs) | 40.21 | 40.06 | 42.39 | 40.89 | 44.20 | 47.59 | 0.7% |
EMU Inflation: Now You See It; Now You Don't!
by Robert Brusca January 6, 2009
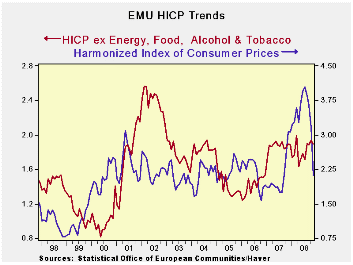
The EMU inflation rate fell sharply in December more sharply
than have been expected. Headline inflation –the measure that the ECB
sets a ceiling for -- is now below that ceiling of 2% at a Yr/Yr rate
of 1.6%. A Yr/Yr rise of 1.8% had been expected. Core (ex food and
energy inflation) has long been on a milder path than that of headline
inflation. But the ECB sets a ceiling for the headline alone. Still,
the headline pace is now more in line with the core where the pace
Yr/Yr is 2.2% (lagged by one month since the December Core is not yet
available- so the real up-to-date core rate is probably even lower).
Core inflation, even through November, shows the six- and three-month
rates of inflation are dropping fast. That is true for headline
inflation as well, as the chart above amply demonstrates.
In short, the ECB now has a set of consistent signals about
inflation. Inflation is now inside its preferred boundaries and
falling. It faces an inflation pace that is well below its ceiling. It
faces a weakening economy. Clearly this inflation result allows for the
ECB policy to be much bolder and for its rhetoric to be much less
circumspect. Even stodgy old central bankers should see the message
clear and strong as indicating that economic weakness is more
pronounced than expected, pushing down prices and not just allowing,
but calling for more aggressive fiscal and monetary policy actions. The
euro weakened in the wake of this report on precisely those sorts of
conclusions by market participants.
| Trends in EMU HICP; Flash Index | |||||||
|---|---|---|---|---|---|---|---|
| % mo/mo | % saar | ||||||
| Dec-08 | Nov-08 | Oct-08 | 3-Mo | 6-Mo | 12-Mo | Yr Ago | |
| EMU-13 | -0.3% | -0.3% | 0.0% | -2.5% | -0.9% | 1.6% | 3.1% |
| Core | #N/A | 0.1% | 0.2% | 1.6% | 2.0% | 2.2% | 2.3% |
| Goods | #N/A | -0.8% | 0.0% | 0.1% | -1.7% | 1.8% | 3.4% |
| Services | #N/A | -0.1% | 0.1% | -2.7% | 1.5% | 2.6% | 2.5% |
| HICP | |||||||
| Germany | -0.5% | -0.1% | -0.3% | -3.3% | -0.9% | 1.1% | 3.1% |
| France | #N/A | -0.4% | 0.1% | -1.4% | 0.0% | 1.9% | 2.6% |
| Italy | -0.1% | -0.5% | 0.3% | -1.1% | 0.0% | 2.3% | 2.8% |
| Spain | #N/A | -0.4% | -0.3% | -2.4% | 0.5% | 2.4% | 4.1% |
| Core:xFE&A | |||||||
| Germany | #N/A | 0.1% | -0.1% | 0.0% | 1.3% | 1.3% | 2.4% |
| Italy | #N/A | 0.0% | 0.5% | 1.9% | 2.7% | 2.8% | 2.2% |
| UK | #N/A | 0.2% | 0.0% | 0.8% | 2.3% | 2.5% | 1.8% |
| Spain | #N/A | 0.1% | 0.1% | 1.5% | 2.6% | 2.7% | 3.3% |
| Blue shaded area data trail by one month | |||||||
U.S. ISM Nonmanufacturing Index Improved Slightly
by Tom Moeller January 6, 2009
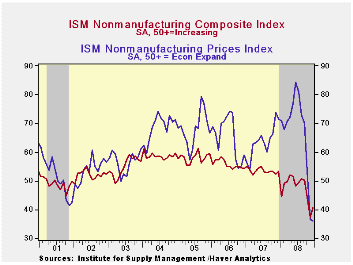
For December, the Composite Index for the nonmanufacturing
sector from the Institute for Supply Management (ISM) improved slightly
to 40.6 from an unrevised 37.3 during November. The figure was firmer
than Consensus expectations for a reading of 37.0 but it was still near
the lowest in the series' relatively brief ten year history. A level of
these ISM indices below 50 indicates declining activity.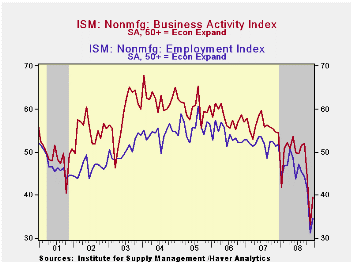
The nonmanufacturing business activity sub-index also made a bit more than half of the sharp November decline, but at 39.6 it was still near the record low for the series. Since the series' inception in 1997 there has been a 48% correlation between the level of the business activity index for the nonmanufacturing sector and the Q/Q change in real GDP for the services and the construction sectors.
In addition, the employment index also edged higher to a reading of 34.7. However, that still indicated sharp layoffs and was near the low for the series. Since the series' inception in 1997 there has been a 56% correlation between the level of the ISM nonmanufacturing employment index and the m/m change in payroll employment in the service-producing plus the construction industries.
The new orders sub-index edged up to a still low 39.9.
Pricing power fell further last month and the reading of 36.0 was a new record low for the series. Since its inception ten years ago, there has been a 60% correlation between the price index and the q/q change in the GDP services chain price index.
Beginning with the January 2008 Nonmanufacturing Report On Business®, the composite index is calculated as an indicator of the overall economic condition for the non-manufacturing sector. It is a composite index based on the diffusion indexes for four of the indicators (business activity, new orders, employment and supplier deliveries) with equal weights. The latest report from the ISM can be found here.
ISM surveys more than 370 purchasing managers in more than 62 industries including law firms, hospitals, government and retailers. The nonmanufacturing survey dates back to July 1997.
| ISM Nonmanufacturing Survey | December | November | December '07 | 2008 | 2007 | 2006 |
|---|---|---|---|---|---|---|
| Composite Index | 40.6 | 37.3 | 53.2 | 47.3 | 53.5 | 55.7 |
| Prices Index | 36.0 | 36.6 | 71.5 | 66.1 | 63.8 | 65.3 |
U.S. Pending Home Sales Lower Still
by Tom Moeller January 6, 2009
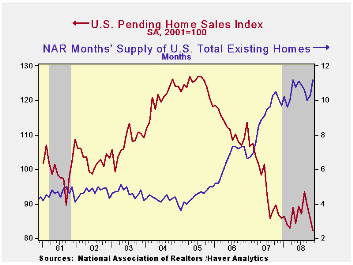
For November, the National Association of Realtors indicated
that pending sales of existing homes fell another 4.0%, about as they
did during the prior two months. The October drop was revised sharply
larger. Consensus expectations were for a 1.0% November decline.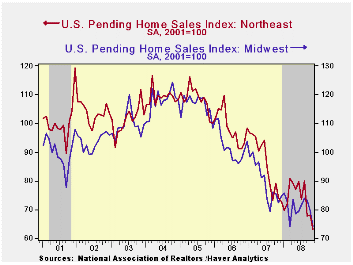
The home sales figures are analogous to the new home sales data from the Commerce Department in that they measure existing home sales when the sales contract is signed, not at the time the sale is closed. The series dates back to 2001.
Sales in the Northeast were the weakest last month and they fell 7.2%. They're down 20.8% during the last three months. Sales in the Midwest suffered from the weakness in the auto industry and fell 6.7%, off 11.6% during the last three months. November sales in the South fell 2.2%, about as they did during October, and they are down 11.7% in the last three months while sales fell 2.4% in the West, 7.6% since August.
Weak home sales are encouraging potential sellers to keep their homes off the market. The Realtors Association indicated in an earlier report that the number of homes on the market and available for sale was about unchanged (-0.3% y/y) after three months of sharp decline.
At the current sales rate there was an 11.2 months' supply of homes on the market, higher than 8.9 months last year and 6.5 months during 2006. For single-family homes the months' supply rose sharply to 10.6, well above the 8.7 average of last year.
The pending home sales data are available in Haver's PREALTOR database and the number of homes on the market and prices are in the REALTOR database.
| Pending Home Sales (2001=100) | November | October | Y/Y | 2007 | 2006 | 2005 |
|---|---|---|---|---|---|---|
| Total | 82.3 | 85.7 | -5.3% | 95.7 | 112.1 | 124.3 |
| Northeast | 63.2 | 68.1 | -14.6 | 85.6 | 98.5 | 108.3 |
| Midwest | 74.2 | 79.5 | -10.1 | 89.6 | 102.0 | 116.4 |
| South | 85.3 | 87.2 | -12.7 | 107.3 | 127.3 | 134.8 |
| West | 101.2 | 103.7 | 19.3 | 92.1 | 109.5 | 128.6 |
U.S. Gasoline Prices Moved Higher
by Tom Moeller January 6, 2008
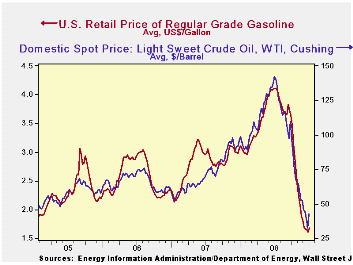
Regular gasoline prices moved seven cents higher last week and nearly recouped the declines of the prior three periods, according to the U.S. Department of Energy survey. Nevertheless, at $1.68 per gallon the price was about even with the December average and down from $2.75 for all of November. Yesterday, the spot market price for a gallon of regular gasoline rose another seven cents to $1.14 per gallon.
Weekly gasoline prices can be found in Haver's WEEKLY database. Daily prices are in the DAILY database.
Product demand continues to fall despite lower prices, pulled down by the developing economic recession. The U.S. Department of Energy reported that the demand for gasoline fell by 3.2% y/y, nearly the fastest rate of decline since late-1995 (the latest four weeks versus the same four weeks last year). The demand for all petroleum products also fell 3.7% y/y.
These DOE figures are available in Haver's OILWKLY database.
The price for a barrel of West Texas Intermediate crude oil also moved higher last week to $42.50 per barrel, the highest level in three weeks and up from the $40.56 averaged last week. Prices reached their high of $145.66 last July. In futures trading yesterday, the one-month price for crude oil was $48.81.
Last week, prices for natural gas recouped the prior week's decline and rose to $5.66 per mmbtu (-26.2% y/y). The latest average price was 50% below natural gas prices in early-July of $13.19/mmbtu.
| Weekly Prices | 01/05/09 | 12/29/08 | Y/Y | 2008 | 2007 | 2006 |
|---|---|---|---|---|---|---|
| Retail Regular Gasoline ($ per Gallon) | 1.68 | 1.61 | -45.8% | 3.25 | 2.80 | 2.57 |
| Light Sweet Crude Oil, WTI ($ per bbl.) | 42.50 | 32.37 | -56.7% | 100.16 | 72.25 | 66.12 |
U.S. Factory Inventories Fell Again
by Tom Moeller January 6, 2009
Factory inventories fell in November. The decline of 0.3%, along with those during prior months, was disproportionately influenced by the decline in oil prices. Less oil, inventories rose 0.2% after a 0.4% October gain. Moreover, the year-to-year change in nonpetroleum inventories has held constant near 6.0%. Evidence of a change in the management of factory sector inventories is, however, evident in the more recent figures. The three-month change in nonpetroleum inventories has been reduced, as a result of production cuts, to 1.5% from its recent high of 9.0%.
Again, one industry recently has dominated even the nonoil figures. Growth in inventories of commercial aircraft has been running at a near-40% year-to-year rate. Less commercial aircraft production cutbacks have reduced factory inventory growth to 1.6% y/y from the high early in 2007 near 10.0%. Automobile inventories have been reduced by 7.8% versus last year. Electrical equipment & appliance inventories have been growing at a 2.0% rate versus double-digit growth early in 2007 and growth in machinery inventories has been nearly halved to 6%.
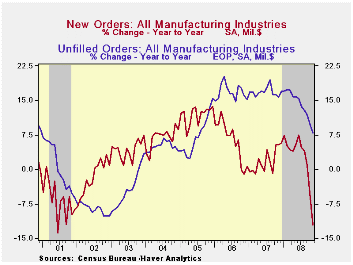
Total factory orders fell 4.6% during November but the figure
very much reflected the decline in oil prices (orders here equal
shipments.) Orders for durable goods orders fell 1.5% and that very
much reflected, as it did in the advance report, the 37.7% drop in
commercial aircraft orders. Less commercial aircraft, orders for
durable goods fell 9.0% y/y, down from a high rate of accumulation near
10%.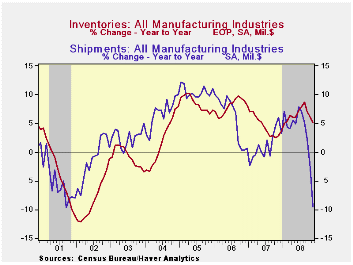
Factory shipments dropped 5.3% due to lower oil prices. Less oil, shipments fell a somewhat lesser 3.4% but they still were down 5.6% y/y. Shipments of transportation equipment fell 18.6% y/y as commercial aircraft shipments plunged 28.9% y/y and automobile shipments fell 21.9%. Shipments of electrical equipment were off 8.6% y/y) and electronic computer shipments fell 31.7% y/y with lower prices. Shipments of furniture & related products fell a hard 12.6% y/y.
Unfilled orders fell 0.6% and the y/y gain of 7.9% is down from the peak near 20%. Less transportation unfilled orders grew 3.4% y/y versus a peak of 16% in 2006.
The minutes to the latest FOMC meeting can be found here.
| Factory Survey (NAICS, %) | November | October | Y/Y | 2007 | 2006 | 2005 |
|---|---|---|---|---|---|---|
| Inventories | -0.3 | -0.6 | 5.1 | 3.7 | 6.4 | 8.9 |
| Excluding Transportation | -0.9 | -1.0 | 3.1 | 2.7 | 7.9 | 8.1 |
| New Orders | -4.6 | -6.0 | -12.2 | 1.9 | 6.2 | 11.9 |
| Excluding Transportation | -4.2 | -5.1 | -9.1 | 1.2 | 7.4 | 11.7 |
| Shipments | -5.3 | -3.6 | -9.6 | 1.2 | 5.9 | 10.4 |
| Excluding Transportation | -5.5 | -3.4 | -8.2 | 1.5 | 6.7 | 11.4 |
| Unfilled Orders | -0.6 | -0.9 | 7.9 | 17.1 | 15.3 | 15.4 |
| Excluding Transportation | -0.9 | -2.0 | 3.4 | 8.2 | 16.0 | 9.2 |
Decline in Production and Lower Inflation in Brazil: A Reduction in the Target Rate (Selic)?
by Louise Curley January 6, 2009
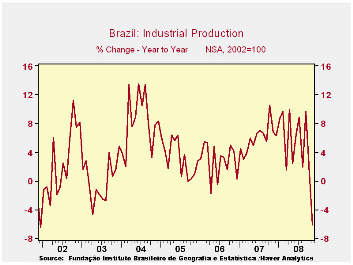
On a seasonally adjusted basis, industrial production in
Brazil fell 5.2% in November from October, following a 2.8% decline in
October from September. The November decline is one of the largest
month to month declines on record. On a seasonally unadjusted basis,
industrial production was 6.2% below November 2007, the largest year to
year decline since December 2001. The year to year declines in
production are shown in the first chart.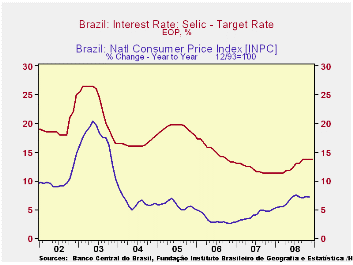
The Automobile, Office machinery and equipment and the Electrical material, devices and communication equipment industries were among the hardest hit, showing year to year declines of 31%, 30% and 21% respectively.
The sharp fall in industrial production has raised the
possibility of a reduction in the target interest rate at the next
meeting of the Monetary Policy Committee (COPOM) of the Central Bank of
Brazil scheduled for January 20, 21, 2009. COPOM has been targeting
inflation and raised the target rate, Selic, from 11.25% in March 2008
to 11.75% in April 2008 . Further increases took place in June, July
and September, when the rate reached 13.75% where it has since
remained. Inflation has now begun to lessen, if only slightly. The
increase in the national consumer price index (INCP) was 7.20% in
November, down from 7.56% in July. The rate of inflation and the target
rate of interest are shown in the second chart.
There is a more general price index--the General Price Index (IGP M)--which is a weighted average of the CPI, WPI and the Cost Construction Indexes and measures the change in prices from the 21st of the previous month to the 20th of the current month. Since the year to year changes in the (IGP M) index are closely correlated with the those of the (INCP) as can be seen in the third chart, the trend in the (IGP M) changes is a good indicator of the trend in the national consumer price index. This Index is published about a week before the national consumer price index and suggests that inflation as measured by the CPI has continued to decline. in December.
| BRAZIL | Dec 08 | Nov 08 | Oct 08 | Sep 08 | Aug 09 | July 08 | June 08 |
|---|---|---|---|---|---|---|---|
| Industrial Production | |||||||
| Month to Month % Change (SA) | -- | -5.16 | -2.83 | 1.80 | -1.28 | 0.74 | 3.03 |
| Year to Year % Change (NSA) | -- | -6.18 | 1.07 | 9.65 | 1.95 | 8.76 | 6.50 |
| Rate of Inflation (INPC) %) | -- | 7.20 | 7.26 | 7.04 | 7.15 | 7.56 | 7.28 |
| Rate of Inflation (IGP M) (%) | 9.81 | 11.88 | 12.23 | 12.31 | 13.63 | 15.12 | 13.44 |
| Target Interest Rate (Selic) (%) | 13.75 | 13.75 | 13.75 | 13.75 | 13.00 | 13.00 | 12.25 |

Tom Moeller
AuthorMore in Author Profile »Prior to joining Haver Analytics in 2000, Mr. Moeller worked as the Economist at Chancellor Capital Management from 1985 to 1999. There, he developed comprehensive economic forecasts and interpreted economic data for equity and fixed income portfolio managers. Also at Chancellor, Mr. Moeller worked as an equity analyst and was responsible for researching and rating companies in the economically sensitive automobile and housing industries for investment in Chancellor’s equity portfolio. Prior to joining Chancellor, Mr. Moeller was an Economist at Citibank from 1979 to 1984. He also analyzed pricing behavior in the metals industry for the Council on Wage and Price Stability in Washington, D.C. In 1999, Mr. Moeller received the award for most accurate forecast from the Forecasters' Club of New York. From 1990 to 1992 he was President of the New York Association for Business Economists. Mr. Moeller earned an M.B.A. in Finance from Fordham University, where he graduated in 1987. He holds a Bachelor of Arts in Economics from George Washington University.
More Economy in Brief


