 Global| Sep 05 2002
U.S. Light Vehicle Sales Firm
by:Tom Moeller
|in:Economy in Brief
Summary
Unit sales of light vehicles were stronger than expected last month as 0% financing plans continued to spur buying. Vehicle sales rose 3.2% versus July and were up 13.1% YTD. Total vehicle sales were the highest since October of last [...]

Unit sales of light vehicles were stronger than expected last month as 0% financing plans continued to spur buying. Vehicle sales rose 3.2% versus July and were up 13.1% YTD. Total vehicle sales were the highest since October of last year.
Sales of domestically built vehicles rose 5.1% m/m following an 11.8% surge in July. Auto sales rose 0.6% m/m but light truck sales surged 8.7%.
Imported vehicle sales fell 5.2% vs. July. Auto sales fell 3.1% and truck sales dropped 9.4%.
Imports' share of the US light vehicle market dropped to 17.0%, the lowest percentage since October of last year.
| Light Vehicle Sales (SAAR, Mil.Units) | Aug | July | Y/Y | 2001 | 2000 | 1999 |
|---|---|---|---|---|---|---|
| Total | 18.68 | 18.10 | 13.8% | 17.25 | 17.40 | 16.95 |
| Domestic | 15.50 | 14.75 | 15.4% | 14.18 | 14.58 | 14.47 |
| Imported | 3.17 | 3.35 | 6.5% | 3.06 | 2.82 | 2.48 |
by Tom Moeller September 5, 2002
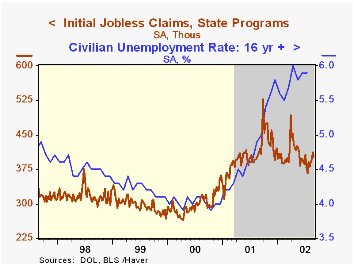
Initial claims for unemployment insurance were higher than expected in the latest week. Claims fell 8,000 versus the prior week (revised up) but a larger decline had been expected.
For the full month of August claims averaged 396,400, the highest level since May.
The four-week moving average rose to 400,000.
Continuing claims for unemployment insurance rose for the fourth week in five versus the prior week's level which was revised down.
The weekly insured rate of unemployment was stable at 2.8%, still down versus the high of 3.0% in May.
| Unemployment Insurance (000s) | 8/31/02 | 8/24/02 | Y/Y | 2001 | 2000 | 1999 |
|---|---|---|---|---|---|---|
| Initial Claims | 403.0 | 411.0 | -2.4% | 405.8 | 299.8 | 297.7 |
| Continuing Claims | -- | 3,578 | 13.0% | 3,021 | 2,114 | 2,186 |
by Tom Moeller September 5, 2002
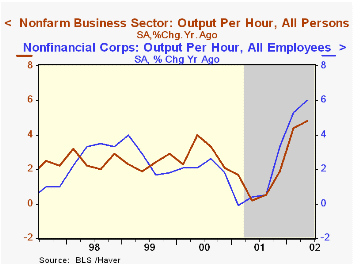
Nonfarm labor productivity grew more than expected last quarter. Consensus estimates were for no change in the 2Q growth rate of 1.1% reported last month.
Output in the nonfarm business sector rose 0.8% versus a 0.5% preliminary estimate. Hours worked fell 0.7%, unchanged from last month's estimate.
Unit Labor costs rose less than originally estimated. Compensation growth was little changed.
Productivity in the nonfinancial business sector, a figure derived from the income side of the National Income Accounts, rose 5.0% following a 5.1% rise in 1Q. Unit labor costs here fell for the fifth consecutive quarter.
Manufacturing sector productivity growth was revised down to 4.4% (5.2% y/y) versus 4.9% estimated last month. Unit labor costs fell 1.2%.
| Nonfarm Business Sector (SAAR) | 2Q '02 (Revised) | 2Q '02 | 1Q '02 | Y/Y | 2001 | 2000 | 1999 |
|---|---|---|---|---|---|---|---|
| Output per Hour | 1.5% | 1.1% | 8.6% | 4.8% | 1.1% | 2.9% | 2.4% |
| Compensation | 3.7% | 3.6% | 3.6% | 2.4% | 2.7% | 7.0% | 4.4% |
| Unit Labor Costs | 2.1% | 2.4% | -4.6% | -2.3% | 1.6% | 3.9% | 2.0% |
by Tom Moeller September 5, 2002
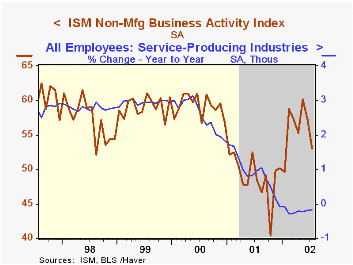
The Institute for Supply Management business activity index of the nonmanufacturing sector was weaker than expected last month, a slight rise versus July had been expected.
The overall index has been above 50, the dividing line for expansion and contraction, since February.
Of the seasonally adjusted subgroups, new orders and imports fell. Employment rose for the second month.
The not seasonally adjusted index of prices fell to the lowest level since March.
During the last five years, there has been a 51% correlation between the level of the NAPM nonmanufacturing index and quarterly growth in real GDP in the service sector.
Business activity for the nonmanufacturing sector is a question separate from the subgroups mentioned above. In contrast, the NAPM manufacturing sector composite index weights the components.
ISM surveys more than 370 purchasing managers in more than 62 industries including construction, law firms, hospitals, government and retailers. The nonmanufacturing survey dates only to July 1997, therefore its seasonal adjustment should be viewed tentatively.
| ISM Nonmanufacturing Survey | Aug | July | Y/Y | 2001 | 2000 | 1999 |
|---|---|---|---|---|---|---|
| Business Activity Index | 50.9 | 53.1 | 46.7 | 49.0 | 59.2 | 59.1 |
by Tom Moeller September 5, 2002
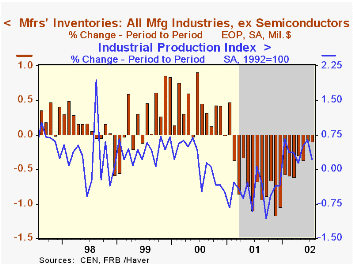
Manufacturing inventories continued to run off in July, but decumulation clearly has slowed. June's decline was unrevised.
Excluding the transportation sector, inventories rose 0.1%, the first monthly gain since January 2001. Inventory accumulation of communications and audio & video equipment was notable, but elsewhere durable goods inventories continued to run off or were up just slightly. Nondurable goods inventories rose 0.4% following a like gain in June. Accumulation of nondurable goods was not broad based, and strongest for petroleum products for the second month.
Shipments recovered 1.6% following a 0.9% June decline (0.0% y/y).
| Inventories | July | June | Y/Y | 2001 | 2000 | 1999 |
|---|---|---|---|---|---|---|
| Mfg Inventories | -0.1% | -0.1% | -7.1% | -8.0% | 4.5% | 3.1% |

Tom Moeller
AuthorMore in Author Profile »Prior to joining Haver Analytics in 2000, Mr. Moeller worked as the Economist at Chancellor Capital Management from 1985 to 1999. There, he developed comprehensive economic forecasts and interpreted economic data for equity and fixed income portfolio managers. Also at Chancellor, Mr. Moeller worked as an equity analyst and was responsible for researching and rating companies in the economically sensitive automobile and housing industries for investment in Chancellor’s equity portfolio. Prior to joining Chancellor, Mr. Moeller was an Economist at Citibank from 1979 to 1984. He also analyzed pricing behavior in the metals industry for the Council on Wage and Price Stability in Washington, D.C. In 1999, Mr. Moeller received the award for most accurate forecast from the Forecasters' Club of New York. From 1990 to 1992 he was President of the New York Association for Business Economists. Mr. Moeller earned an M.B.A. in Finance from Fordham University, where he graduated in 1987. He holds a Bachelor of Arts in Economics from George Washington University.
More Economy in Brief


