 Global| Jun 04 2008
U.S. Light Vehicle Sales Down in May; Truck Sales Lowest Since 1996
by:Tom Moeller
|in:Economy in Brief
Summary
U.S. sales of light vehicles in May fell another 1.1% m/m to a 14.30M unit annual selling rate, according to the Autodata Corporation. It was the fourth m/m decline this year and so far in 2008 vehicle sales have fallen 11.7%. The [...]
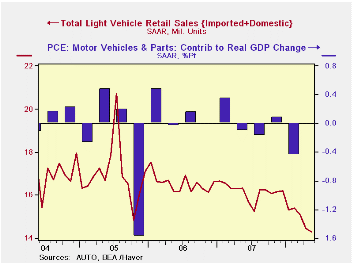
U.S. sales of light vehicles in May fell another 1.1% m/m to a 14.30M unit annual selling rate, according to the Autodata Corporation. It was the fourth m/m decline this year and so far in 2008 vehicle sales have fallen 11.7%. The level of vehicle sales also was lower than Consensus expectations for sales of 14.6M.
Overall, sales of domestically made light vehicles fell 1.3% last month and were off 14.5% YTD, at the lowest level since early 1992.
Higher gasoline prices continued to hit sales of relatively fuel inefficient domestically made light trucks. Sales fell 9.8% m/m during May and that brought the decline this year to 25.6%. Sales of U.S. made cars have held up relatively well and posted an 8.8% increase last month and are roughly unchanged since yearend.
Sales of imported light vehicles slipped just 0.7% m/m to 3.97M units after a 2.1% April decline. Sales of imported autos rose 3.8% after a 0.4% April slip and so far this year sales of imported cars are up 5.8%. Sales of imported light trucks, however, felt some of the effect from higher gas prices and fell 9.7%; off 19.6% so far this year.
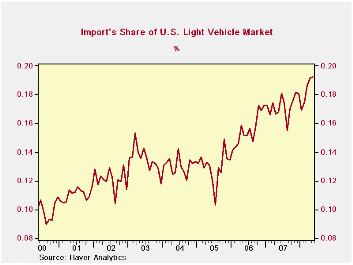
Import's share of the U.S. light vehicle
market rose slightly to another record level of 27.9%. (Imported
vehicles are those produced outside the U.S. and does not include
vehicles with the nameplate of a foreign manufacturer produced within
the U.S.) Imports' share of the U.S. car market rose to 34.6% and the
share of the light truck market was 19.2%; both records and more than
double the shares ten years ago.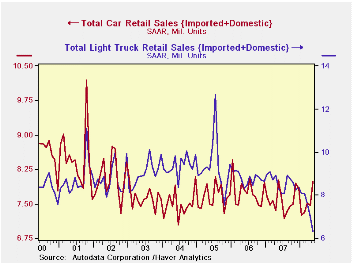
| Light Vehicle Sales (SAAR, Mil. Units) | May | April | Y/Y | 2007 | 2006 | 2005 |
|---|---|---|---|---|---|---|
| Total | 14.30 | 14.46 | -12.5% | 16.17 | 16.54 | 16.96 |
| Autos | 7.98 | 7.46 | -0.3% | 7.58 | 7.77 | 7.65 |
| Domestic | 5.22 | 4.80 | -2.9% | 5.07 | 5.31 | 5.40 |
| Imported | 2.76 | 2.66 | 5.0% | 2.51 | 2.45 | 2.25 |
| Light Trucks | 6.32 | 7.00 | -24.1% | 8.60 | 8.78 | 9.32 |
| Domestic | 5.11 | 5.66 | -26.4% | 7.12 | 7.42 | 8.12 |
| Imported | 1.21 | 1.34 | -13.2% | 1.48 | 1.37 | 1.20 |

Tom Moeller
AuthorMore in Author Profile »Prior to joining Haver Analytics in 2000, Mr. Moeller worked as the Economist at Chancellor Capital Management from 1985 to 1999. There, he developed comprehensive economic forecasts and interpreted economic data for equity and fixed income portfolio managers. Also at Chancellor, Mr. Moeller worked as an equity analyst and was responsible for researching and rating companies in the economically sensitive automobile and housing industries for investment in Chancellor’s equity portfolio. Prior to joining Chancellor, Mr. Moeller was an Economist at Citibank from 1979 to 1984. He also analyzed pricing behavior in the metals industry for the Council on Wage and Price Stability in Washington, D.C. In 1999, Mr. Moeller received the award for most accurate forecast from the Forecasters' Club of New York. From 1990 to 1992 he was President of the New York Association for Business Economists. Mr. Moeller earned an M.B.A. in Finance from Fordham University, where he graduated in 1987. He holds a Bachelor of Arts in Economics from George Washington University.
More Economy in Brief


