 Global| Feb 04 2004
U.S. Light Vehicle Sales Below Expectations
by:Tom Moeller
|in:Economy in Brief
Summary
Unit sales of light vehicles fell 9.1% m/m in January to 16.13M, the lowest level since October. Consensus expectations were for sales of 17.0M. Revised seasonal factors altered the monthly figures for 2003. Car sales fell 7.4% m/m to [...]
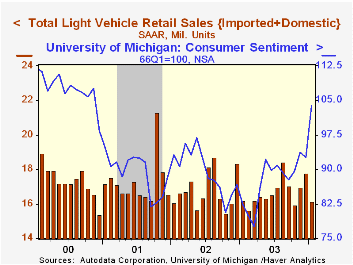
Unit sales of light vehicles fell 9.1% m/m in January to 16.13M, the lowest level since October. Consensus expectations were for sales of 17.0M. Revised seasonal factors altered the monthly figures for 2003.
Car sales fell 7.4% m/m to 7.06M for the second consecutive monthly decline. The peak for car sales was in 1986 at 11.41M.
Sales of light trucks fell 10.5% to 9.07M and reversed all of the gain in December.
Domestic light vehicle sales fell 10.5% m/m to 13.11M (+1.9% y/y).
Imported vehicle sales fell 3.0% m/m to 3.02M (-8.7% y/y). Imports captured 18.7% of the US market for new vehicles in January versus 19.7% for all of 2003.
| Light Vehicle Sales (SAAR, Mil.Units) | Jan | Dec | Y/Y | 2003 | 2002 | 2001 |
|---|---|---|---|---|---|---|
| Total | 16.13 | 17.75 | -0.3% | 16.69 | 16.81 | 17.26 |
| Autos | 7.06 | 7.63 | -12.2% | 7.63 | 8.07 | 8.48 |
| Light Trucks | 9.07 | 10.12 | 11.4% | 9.06 | 8.74 | 8.78 |
by Tom Moeller February 4, 2004
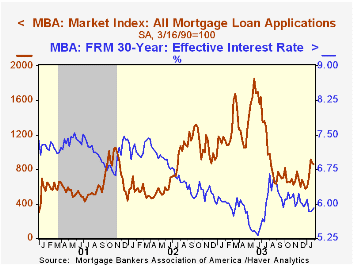
The index of mortgage applications compiled by the Mortgage Bankers Association fell 1.5% last week, adding to the 5.2% decline the prior week. For the month of January applications rose 27.0% from December due to a surge mid-month.
Applications to refinance fell a modest 1.4% after the 0.9% dip the prior week.
Purchase applications fell 1.7% w/w on top of the 10.0% decline the prior week. Purchase applications were up 9.6% in January versus December.
During the last ten years there has been a 54% correlation between the y/y change in purchase applications and the change in new plus existing home sales.
The effective interest rate on a conventional 30-Year mortgage rose to 5.92% from 5.87% the prior week. The effective rate on a 15-year mortgage rose to 5.26%.
The Mortgage Bankers Association surveys between 20 to 35 of the top lenders in the U.S. housing industry to derive its refinance, purchase and market indexes. The weekly survey accounts for more than 40% of all applications processed each week by mortgage lenders. Visit the Mortgage Bankers Association site here.
| MBA Mortgage Applications (3/16/90=100) | 1/30/04 | 1/23/04 | 2003 | 2002 | 2001 |
|---|---|---|---|---|---|
| Total Market Index | 855.7 | 868.9 | 1,067.9 | 799.7 | 625.6 |
| Purchase | 444.0 | 451.6 | 395.1 | 354.7 | 304.9 |
| Refinancing | 3,250.6 | 3,296.7 | 4,981.8 | 3,388.0 | 2,491.0 |
by Tom Moeller February 4, 2004
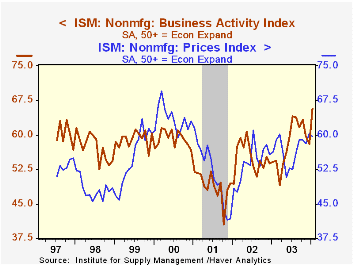
The Business Activity Index for the non-manufacturing sector, reported by the Institute for Supply Management, surged last month to a record high for the series' seven year history. The jump to 65.7 versus 58.0 in December was versus Consensus expectations for a moderate gain to 60.0.
New orders led the increase and jumped to 64.9 from 59.5 in December, a near record for the series.
The employment index fell to 53.4 versus 54.0 in December. It was the sixth month in seven above 50.
Since the series' inception in 1997 there has been a 67% correlation between the level of the ISM non-manufacturing employment index and the m/m change in payroll employment in the service producing and construction industries.Business activity for the non-manufacturing sector is a question separate from the subgroups mentioned above. In contrast, the NAPM manufacturing sector composite index weights the components.
The seasonally adjusted prices index fell to 59.7 from 60.3 in December.
ISM surveys more than 370 purchasing managers in more than 62 industries including construction, law firms, hospitals, government and retailers. The non-manufacturing survey dates only to July 1997, therefore its seasonal adjustment should be viewed tentatively.
| ISM Nonmanufacturing Survey | Jan | Dec | Y/Y Jan '03 | 2003 | 2002 | 2001 |
|---|---|---|---|---|---|---|
| Business Activity Index | 65.7 | 58.0 | 54.2 | 58.1 | 55.1 | 48.9 |
| Prices Index | 59.7 | 60.3 | 56.4 | 56.7 | 53.9 | 51.5 |
by Tom Moeller February 4, 2004
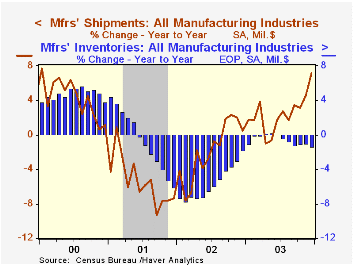
Factory orders jumped an unexpected 1.1% in December. The gain was led by a 2.0% (6.7% y/y) surge in orders for non-durables. Gains were logged across most non-durable industries. (Orders for non-durables equal shipments in this report.)
The advance report of a slight decline in durable goods orders in December was revised to a slight 0.3% increase.
Factory shipments jumped 1.5%, reflecting broad based strength, notably for machinery.
Manufacturing inventories fell just slightly for the second consecutive month.
| Factory Survey (NAICS) | Dec | Nov | Y/Y | 2003 | 2002 | 2001 |
|---|---|---|---|---|---|---|
| Inventories | -0.0% | -0.1% | -1.4% | -1.4% | -1.8% | -6.1% |
| New Orders | 1.1% | -0.9% | 8.0% | 3.6% | -1.9% | -6.7% |
| Shipments | 1.5% | 0.5% | 7.2% | 2.5% | -2.0% | -5.4% |
| Unfilled Orders | 0.4% | 0.7% | 4.1% | 4.1% | -6.1% | -5.9% |

Tom Moeller
AuthorMore in Author Profile »Prior to joining Haver Analytics in 2000, Mr. Moeller worked as the Economist at Chancellor Capital Management from 1985 to 1999. There, he developed comprehensive economic forecasts and interpreted economic data for equity and fixed income portfolio managers. Also at Chancellor, Mr. Moeller worked as an equity analyst and was responsible for researching and rating companies in the economically sensitive automobile and housing industries for investment in Chancellor’s equity portfolio. Prior to joining Chancellor, Mr. Moeller was an Economist at Citibank from 1979 to 1984. He also analyzed pricing behavior in the metals industry for the Council on Wage and Price Stability in Washington, D.C. In 1999, Mr. Moeller received the award for most accurate forecast from the Forecasters' Club of New York. From 1990 to 1992 he was President of the New York Association for Business Economists. Mr. Moeller earned an M.B.A. in Finance from Fordham University, where he graduated in 1987. He holds a Bachelor of Arts in Economics from George Washington University.
More Economy in Brief


