 Global| Jun 18 2009
U.S. Leading Indicators Rise Sharply For A Second Month
by:Tom Moeller
|in:Economy in Brief
Summary
The Conference Board's leading index again suggested a coming turn in economic activity. The May composite index of leading economic indicators jumped another 1.2% following the upwardly revised 1.1% April gain. The increases [...]
The Conference Board's leading index again suggested a coming turn in economic activity. The May composite index of leading economic indicators jumped another 1.2% following the upwardly revised 1.1% April gain. The increases recovered the declines during the prior several months and left the index at its highest level since last September. The leading index is based on actual reports for eight economic data series. The Conference Board initially estimates two series, orders for consumer goods and orders for capital goods.
Nearly three quarters of the ten components of the leading index increased last month with the largest positive contributions coming from higher stock prices, a higher money supply, a more positively sloped interest rate yield curve and vendor performance (slower delivery speeds). Initial unemployment insurance claims, weekly hours worked and factory orders made negative contributions.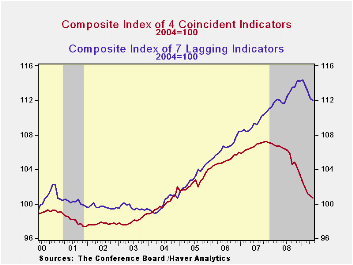
Suggesting that the rate of decline in the economy is slowing were the coincident indicators. They fell 0.2% for the second month and that compared with 0.6% to 1.1% monthly declines since last September. The negative contributions from lower employment and production eased. Half of the four component series rose during May led by gains in real disposable income and business sales. Over the last ten years there has been a 76% correlation between this y/y change and real GDP.
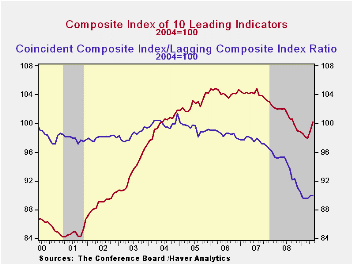
In a sign that excesses in the U.S. economy are diminishing, the lagging index fell for the fifth month in the last six. The ratio of coincident-to-lagging indicators (a measure of economic excess) was unchanged m/m at the highest level this year.The Conference Board figures are available in Haver's BCI database. Visit the Conference Board's site for coverage of leading indicator series from around the world.
IMF Asked to Aid G-8 With Exit Strategies For Crisis Policies can be found here.
| Business Cycle Indicators (%) | May | April | March | Feb. 6-Month % (AR) | 2008 | 2007 | 2006 |
|---|---|---|---|---|---|---|---|
| Leading | 1.2 | 1.1 | -0.3 | 2.4 | -2.8 | -0.3 | 1.5 |
| Coincident | -0.2 | -0.3 | -0.7 | -6.4 | -0.8 | 1.6 | 2.5 |
| Lagging | -0.2 | -0.8 | -0.6 | -4.0 | 2.9 | 2.8 | 3.3 |
by Tom Moeller June 18, 2009
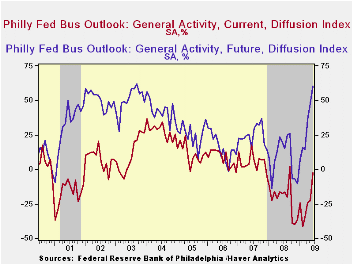
The Philadelphia Federal Reserve Bank indicated that factory sector activity in the region contracted during June but at the slowest rate since a slight advance during September of last year. The Index of General Activity in the manufacturing sector came in at -2.2 versus Consensus expectations for a reading of -17.0. The This index reflects a question separate from the components which are surveyed separately.
During the last ten years there has been a 77% correlation between the level of the Philadelphia Fed Business Conditions Index and the three-month growth in factory sector industrial production. There has been a 70% correlation with q/q growth in real GDP.
Amongst the sub-indexes shipments turned positive for the first time since May of last year. The new orders, inventory and employment indexes each rose sharply but were still negative. A reduced thirty-one percent of respondents expected to lower employment levels and an improved ten percent expected to raise them. During the last ten years there has been a 79% correlation between the index level and the m/m change in manufacturing sector payrolls.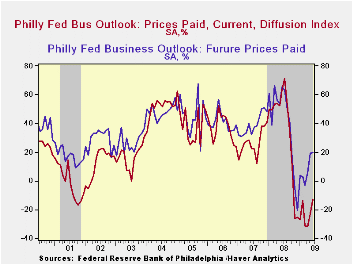
The prices paid index rose to a less-negative 13.0. Only five percent of respondents planned to raise prices while eighteen percent expected to lower them. During the last ten years there has been a 74% correlation between the prices paid index and the three-month growth in the intermediate goods PPI. There has been an 83% correlation with the change in core intermediate goods prices.
The separate index of expected business conditions in six months improved to its highest level since 2003. The expectations index for new orders, shipments and employment each were up sharply from their winter lows. Expectations for prices also are sharply improved during the last six months
The figures from the Philadelphia Federal Reserve can be found in Haver's SURVEYS database.
The latest Business Outlook Survey from the Federal Reserve Bank of Philadelphia can be found here.
Residential Housing and Personal Bankruptcy from the Federal Reserve Bank of Philadelphia is available here.
| Philadelphia Fed (%) | June | May | June '08 | 2008 | 2007 | 2006 |
|---|---|---|---|---|---|---|
| General Activity Index | -2.2 | -22.6 | -17.7 | -21.3 | 5.0 | 8.0 |
| Prices Paid Index | -13.0 | -22.8 | 63.4 | 36.4 | 26.3 | 36.7 |
by Tom Moeller June 18, 2009
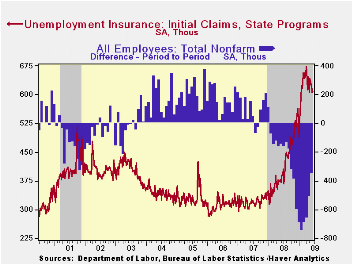
The decline in initial claims from their high is leading evidence of labor market improvement. Though initial claims for unemployment insurance edged up last week, they remained near the lowest level since late-January. Claims inched up by 3,000 to 608,000 after a revised 20,000 decline during the prior week which was revised a bit shallower. Initial claims were down from their March peak of 674,000. In addition, the four-week average of claims, which smoothes out some of the volatility in the weekly numbers, fell to 615,750 which was its lowest level since since mid-February. Still, the level remained up by two-thirds from the year ago level. The latest level about matched the Consensus expectation which was for 605,000 claims.
The latest claims figure is for the survey week for June nonfarm payrolls. Claims fell 28,000 (4.4%) from the May survey period. During the last ten years there has been an 86% correlation between the level of claims and the change in nonfarm payrolls.
The Labor Department indicated that the largest increases in initial claims for the week ending June 6 were in Pennsylvania (+6,861), Florida (+6,469), Ohio (+5,104), California (+4,894), and New York (+4,795), while the largest decreases were in Arkansas (-1,206), Puerto Rico (-1,131), Wisconsin (-707), Arizona (-693), and Nebraska (-450).
Modest improvement in the job market finally evidenced itself in a lower level of continuing claims for unemployment insurance. They fell for the first time since early January and the decline was a large 148,000 (2.2%). Continuing claims provide an indication of workers' ability to find employment. At 6,687,000, however, claims remained more than twice the year ago level. Further suggesting that the job market's improvement is just modest was that the four-week average of continuing claims rose to another record of 6,757,500. The series dates back to 1966.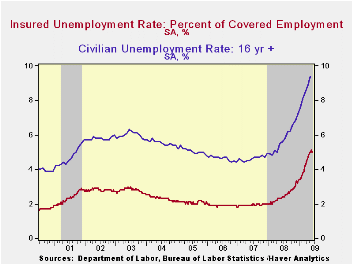
Also indicating marginal labor market improvement was that the insured unemployment rate slipped to 5.0% from 5.1%. The level remained more than double June of 2008 and the highest since 1983. During the last ten years there has been a 93% correlation between the level of the insured unemployment rate and the overall rate of unemployment published by the Bureau of Labor Statistics.
Clearly, the latest weekly figure understates labor market distress in some states.The highest insured unemployment rates in the week ending May 30 were in Michigan (7.5 percent), Oregon (7.0), Nevada (6.3), Puerto Rico (6.3), Pennsylvania (6.2), Wisconsin (6.0), Arkansas (5.6), South Carolina (5.5), California (5.4), and North Carolina (5.4).
The unemployment insurance claims data is available in Haver's WEEKLY database and the state data is in the REGIONW database.
Community Development Financial Institutions: Challenges and Opportunities is the title of yesterday's speech by Fed Chairman Ben S, Bernanke and it is available here.
| Unemployment Insurance (000s) | 06/13/09 | 06/06/09 | 05/30/09 | Y/Y | 2008 | 2007 | 2006 |
|---|---|---|---|---|---|---|---|
| Initial Claims | 608 | 605 | 625 | 55.9% | 420 | 321 | 313 |
| Continuing Claims | -- | 6,687 | 6,835 | 115.9% | 3,342 | 2,552 | 2,459 |

Tom Moeller
AuthorMore in Author Profile »Prior to joining Haver Analytics in 2000, Mr. Moeller worked as the Economist at Chancellor Capital Management from 1985 to 1999. There, he developed comprehensive economic forecasts and interpreted economic data for equity and fixed income portfolio managers. Also at Chancellor, Mr. Moeller worked as an equity analyst and was responsible for researching and rating companies in the economically sensitive automobile and housing industries for investment in Chancellor’s equity portfolio. Prior to joining Chancellor, Mr. Moeller was an Economist at Citibank from 1979 to 1984. He also analyzed pricing behavior in the metals industry for the Council on Wage and Price Stability in Washington, D.C. In 1999, Mr. Moeller received the award for most accurate forecast from the Forecasters' Club of New York. From 1990 to 1992 he was President of the New York Association for Business Economists. Mr. Moeller earned an M.B.A. in Finance from Fordham University, where he graduated in 1987. He holds a Bachelor of Arts in Economics from George Washington University.
More Economy in Brief


