 Global| Sep 21 2009
U.S. Leading Indicators Rise For AFifth Straight Month And Signal Economic Recovery
by:Tom Moeller
|in:Economy in Brief
Summary
The Conference Board's Index of Leading Economic Indicators continued to suggest a pending economic recovery with a 0.6% August increase that was close to expectations. The rise in the composite index of leaders was the fifth in a row [...]
 The
Conference Board's Index of Leading Economic Indicators continued to
suggest a pending economic recovery with a 0.6% August increase that
was close to expectations. The rise in the composite index of leaders
was the fifth in a row and the 4.7% increase during those five months
was the strongest since early-1983. The index itself was at the highest
level since January of last year. The leading index is based on actual
reports for eight economic data series. The Conference Board initially
estimates two series, orders for consumer goods and orders for capital
goods.
The
Conference Board's Index of Leading Economic Indicators continued to
suggest a pending economic recovery with a 0.6% August increase that
was close to expectations. The rise in the composite index of leaders
was the fifth in a row and the 4.7% increase during those five months
was the strongest since early-1983. The index itself was at the highest
level since January of last year. The leading index is based on actual
reports for eight economic data series. The Conference Board initially
estimates two series, orders for consumer goods and orders for capital
goods.
Perhaps tempering the outlook was that the 0.6% August increase in the leaders was the weakest of the last five months. Moreover, a slightly diminished 60% of the index components rose. Higher stock prices and a steeper interest rate yield curve, along with a slower speed of vendor deliveries, made the largest positive contributions to the latest overall increase in the leaders. However, the real money supply fell for the fourth month in the last five and average weekly factory hours worked were unchanged as were new orders for consumer goods & materials.
 Continuing
to
suggest that the rate of decline in the economy is slowing were the
coincident indicators. They were unchanged during August after a slim
0.1% July gain. While hardly indicative of a robust economy, these
declines compare with monthly shortfalls of 0.6%-to-1.1% dating back to
September. Fostering the turnaround have been slight increases in
industrial production and real personal income as well as diminished
monthly declines in payrolls.
Continuing
to
suggest that the rate of decline in the economy is slowing were the
coincident indicators. They were unchanged during August after a slim
0.1% July gain. While hardly indicative of a robust economy, these
declines compare with monthly shortfalls of 0.6%-to-1.1% dating back to
September. Fostering the turnaround have been slight increases in
industrial production and real personal income as well as diminished
monthly declines in payrolls.
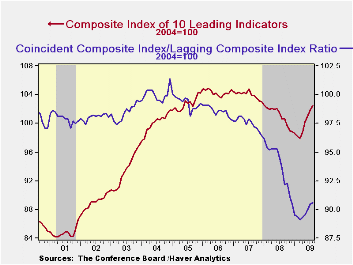
Wringing out past economic
excesses is needed for real economic recovery. In a further sign that
excesses in the U.S. economy are diminishing, the lagging index fell
for the eight month in the last nine. To that point, C&I loans
outstanding fell sharply for the ninth straight month and consumer
credit versus personal income was off for the fifth month this year.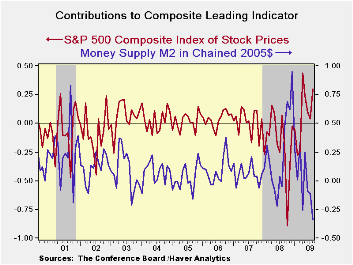 Regardless, the average duration of unemployment shortened and the
change in CPI for services eased. The ratio of coincident-to-lagging
indicators (a measure of economic excess) also continued higher for the
fifth straight month to the highest level since November.
Regardless, the average duration of unemployment shortened and the
change in CPI for services eased. The ratio of coincident-to-lagging
indicators (a measure of economic excess) also continued higher for the
fifth straight month to the highest level since November.
The Conference Board figures are available in Haver's BCI database. Visit the Conference Board's site for coverage of leading indicator series from around the world.
Beyond Inflation Targeting: Should Central Banks
Target the Price Level? from the Federal Reserve Bank
of Kansas City is available here.
How Will Unemployment Fare Following the Recession? also from the Federal Reserve Bank of Kansas City can be found here.
| Business Cycle Indicators (%) | August | July | June | May 6-Month % (AR) | 2008 | 2007 | 2006 |
|---|---|---|---|---|---|---|---|
| Leading | 0.6 | 0.9 | 0.8 | 6.2 | -2.8 | -0.3 | 1.5 |
| Coincident | 0.0 | 0.1 | -0.4 | -5.4 | -0.9 | 1.6 | 2.5 |
| Lagging | -0.1 | -0.5 | -0.9 | -8.6 | 2.9 | 2.8 | 3.3 |
by Tom Moeller September 21, 2009
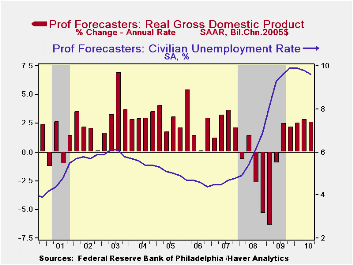 Each
quarter, the Federal Reserve Bank of Philadelphia surveys a group of
professional forecasters to gain perspective on the outlook for the
U.S. economy. In the August survey, the panel expected the recession to
have reached its end, though the recovery is expected to be subpar.
That subpar nature is expected to keep unemployment high but it is not
expected to prevent inflation and interest rates from rising.
Each
quarter, the Federal Reserve Bank of Philadelphia surveys a group of
professional forecasters to gain perspective on the outlook for the
U.S. economy. In the August survey, the panel expected the recession to
have reached its end, though the recovery is expected to be subpar.
That subpar nature is expected to keep unemployment high but it is not
expected to prevent inflation and interest rates from rising.
Just 2.4% growth in real GDP is expected during the current quarter to be followed by growth at about that rate into next year. That follows the 3.9% y/y drop in real GDP through last quarter, which was the deepest decline since the Great Depression. Indeed, this recovery is subpar compared to prior periods of severe recession. Following the 1973-75 recession, when GDP fell at a peak y/y rate of 2.3%, growth shortly rebounded to 6.2%. Similarly following the 1981-82 recession, when GDP fell 2.7% y/y, a snapback came quickly at near an 8% rate.
The subpar nature of the coming economic
recovery stems very much from the consumer who remains burdened by
excessive levels of debt. 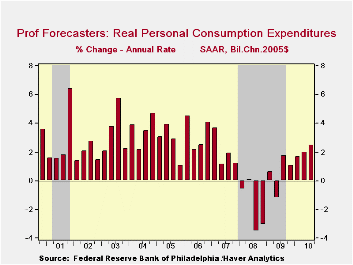
A swing towards inventory accumulation also should play a part in the pending economic recovery, yet here again it's not a huge part. Accumulation at near a $20 billion annual rate is expected by the end of next year. Certainly that is improved from the peak rate of decumulation of $141 last quarter, and the dollar swing is impressive. But as a percentage of the economy's overall real size it amounts to barely half the swing after prior severe recessions. As for the foreign trade deficit, recent improvement has helped forestall an even deeper decline in U.S. GDP during this recession. However, that improvement is expected to now end with little or no improvement through next year as foreign economies remain weak.
Weak
economic growth is expected to do little reduce unemployment. The
unemployment rate is expected to average 9.9% and then dip just to 9.6%
by next year's third quarter. 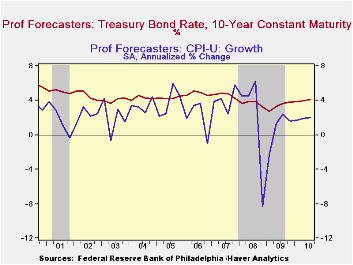 These rates are the highest jobless rates
since 1982-83 and reflect little or no growth in expected employment.
Pricing power is thus expected to be severely constrained. The y/y
growth in the overall GDP price deflator is expected to drift up to
1.5% from its low of 1.0% this year. Perhaps not-so-surprisingly,
forecasters expect that lift to stem from a liquidity-driven rise in
core consumer prices to 1.6% from a low of 1.1% being reached now.
Ten-year Treasury yields are expected to rise in tandem to highs near
4% by the middle of next year.
These rates are the highest jobless rates
since 1982-83 and reflect little or no growth in expected employment.
Pricing power is thus expected to be severely constrained. The y/y
growth in the overall GDP price deflator is expected to drift up to
1.5% from its low of 1.0% this year. Perhaps not-so-surprisingly,
forecasters expect that lift to stem from a liquidity-driven rise in
core consumer prices to 1.6% from a low of 1.1% being reached now.
Ten-year Treasury yields are expected to rise in tandem to highs near
4% by the middle of next year.
The full Third Quarter 2009 Survey of Professional Forecasters from the Federal Reserve Bank of Philadelphia is available here
. The data are available in Haver's SURVEYS database.| FRB Philadelphia Survey of Professional Forecasters (AR) | 2Q '09 | 3Q '09 | 4Q '09 | 1Q '10 | 2Q '10 |
|---|---|---|---|---|---|
| Real GDP | -1.0% | 2.4% | 2.2% | 2.5% | 2.8% |
| PCE | -1.2 | 1.7 | 1.1 | 1.7 | 2.0 |
| Non-Residential Investment | -8.9 | -7.3 | -6.3 | 2.1 | 3.8 |
| Residential Investment | -29.3 | -7.3 | 1.8 | 5.6 | 13.4 |
| Federal Government | 10.9 | 6.2 | 4.1 | 1.5 | 2.1 |
| Change in Business Inventories | $-141.1B | $-89.9B | $-32.7B | $-1.7B | $9.5B |
| Net Exports | -339.3 | -340.0 | -342.1 | -353.6 | -366.0 |
| Unemployment Rate (%) | 9.3 | 9.6 | 9.9 | 9.9 | 9.8 |
| Consumer Price Index (Y/Y, %) | 2.4 | 1.7 | 1.1 | 1.5 | 1.5 |
by Robert Brusca September 21, 2009
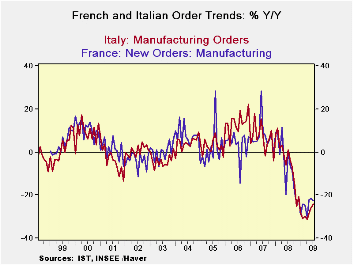
French orders were up by a solid 2% in July as foreign orders
surged by 14%. In Italy orders jumped by 3.2% on foreign order strength
of 15.6%. Both Italy and France as seeing strong orders in the new
quarter (Q3, one month in) led by huge gains in orders from abroad.
Both Italy and France show recovery patterns of order growth
but order levels that remain just a bit less than 25% below year-ago
levels.
Europe- Europe continues to show economic recovery. But with
the G-20 set to meet in the re-made but old US industrial city of
Pittsburgh, the OECD, the IMF and a German think-tank have taken this
opportunity to highlight the risks to the future of this recovery. The
OECD is very concerned about the health of banks and that there could
be some backsliding and troubles with capitalization. The IMF is
concerned that German employment could rise sharply over the next year,
pushing unemployment to over 10.5% and creating weak growth under 0.5%
in 2010. This would clearly become a problem for growth in the rest of
the e-Zone. Not to be outdone by this sort of sour outlook, the German
think-tank IWH Institute warns of a credit crunch highlighting the
potential for a double dip as government stimulus programs come off the
books.
Pessimism shuns trends: Despite some very strong current
indicators that spread across the major EMU economies there remains in
Europe, much like in the US, a core of pessimism about the risks.
Unlike after other recessions apparently this recovery cannot be
trusted to bottom and begin to rise and for that upswing to be
self-sustaining. The abnormal degree of and scope of early government
help that will eventually be rescinded is one of the common culprits in
both US and European pessimism. If that is so what ever do it in the
first place?
Professional pessimists: While we expect the main
international regulators and oversight agencies to be less than
cheerleaders and to be wary of risks, the extent to which private
sector naysayers have piggy-backed on that tact is surprising. For now
we are left with the reality of an upswing and one that is looking
quite nice and consistent across EMU nations. Meanwhile, the outlook
sours as we speak. While the future may still hold risks, one must
wonder if they are as great as is being said or if lowering
expectations has been taken to a new extreme by politicians who in the
end are chastened by their own role in this crisis by seeing it develop
and watching powerlessly, aware that it is a disaster that occurred on
their watch.
| Italy Orders | ||||||
|---|---|---|---|---|---|---|
| Saar exept m/m | Jul-09 | Jun-09 | May-09 | 3-mo6-mo12-mo | ||
| Total | 3.2% | 2.6% | 0.8% | 29.5% | -1.9% | -24.2% |
| Foreign | 15.6% | 2.6% | 0.9% | 105.4% | 17.6% | -19.1% |
| Domestic | -2.9% | 2.5% | 0.7% | 0.9% | -11.3% | -26.9% |
| Memo | ||||||
| Sales | 0.7% | -1.6% | -1.0% | -7.4% | -11.0% | -22.1% |
| French Orders | ||||||
| Saar exept m/m | Jul-09 | Jun-09 | May-09 | 3-mo6-mo12-mo | ||
| Total | 2.0% | 1.2% | 0.0% | 13.7% | 5.6% | -22.6% |
| Foreign | 14.0% | -3.0% | 7.0% | 96.1% | 19.1% | -16.7% |
| IP xConstruct | 0.6% | 0.2% | 3.0% | 16.3% | 2.8% | -13.8% |
Recent Data For The Russian Economy
by Louise Curley September 21, 2009
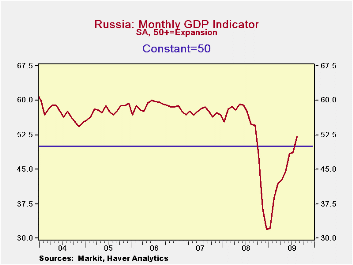 Preliminary data suggest that the Russian Gross Domestic
Product, fell 0.5% in the second quarter, a marked improvement over the
9.0% decline in the first quarter. (These figures are based on the
series that have been seasonally adjusted by Haver Analytics.) August
data on production, construction, and retail sales have been
disappointing. Production and construction declined in contrast to
increases in July and retail sales showed a smaller increase in August
than in July. The unemployment rate, however, was 8.6% in August 2
basis points below July.
Preliminary data suggest that the Russian Gross Domestic
Product, fell 0.5% in the second quarter, a marked improvement over the
9.0% decline in the first quarter. (These figures are based on the
series that have been seasonally adjusted by Haver Analytics.) August
data on production, construction, and retail sales have been
disappointing. Production and construction declined in contrast to
increases in July and retail sales showed a smaller increase in August
than in July. The unemployment rate, however, was 8.6% in August 2
basis points below July.
In spite of the July hiccup particularly in industrial
production, the prospects for increased activity in Russia have
brightened. Oil prices are up, the Reserve Bank has steadily lowered
the refinancing rate from 13% in March to 10.5% in September.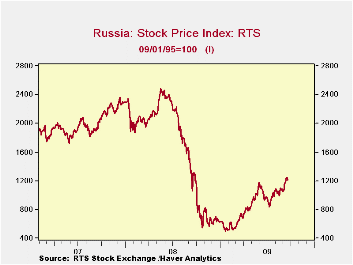 Inflation, though still high, was 11.6% in August, down from 13.15% in
April. Recent data for these aspects of the Russian economy are shown
in the table below.
Inflation, though still high, was 11.6% in August, down from 13.15% in
April. Recent data for these aspects of the Russian economy are shown
in the table below.
The Purchasing Mangers Survey published by Markit Economics in London reported earlier this month that the GDP indicator for Russia reached the expansion stage in August (above 50) for the first time since September, 2008 as shown in the first chart. Finally, the Stock Market has increased 44% from the recent low point reached on July10 and 1208 today is 139% above the low reached on February 2, 2009. The decline and rise in the stock market is shown in the second chart.
| RUSSIA | Sep 09 | Aug 09 | Jul 09 | Jun 09 | May 09 | Apr 09 | Mar 09 |
|---|---|---|---|---|---|---|---|
| Industrial Production (M/M % Chg) | -- | -3.0 | 4.7 | 4.5 | -2.1 | -8.1 | -- |
| Retail Sales (M/M % Chg) | -- | 1.68 | 2.36 | 0.88 | 1.70 | 0.71 | -- |
| Value of Construction Work Performed (M/M % Chg) | -- | -2.66 | 2.61 | 210.55 | 0.74 | 11.54 | -- |
| Unemployment Rate (%) | -- | 8.6 | 8.8 | 8.7 | 8.9 | 8.7 | -- |
| Inflation (%) | -- | 11.6 | 12.0 | 11.9 | 12.3 | 13.2 | -- |
| Refinancing Rate (%) | 10.50 | 10.75 | 11.00 | 11.50 | 12.00 | 12.50 | 13.00 |
| Oil Price Brent Crude (Ave of Daily Prices $ per barrel) | -- | 72.86 | 65.62 | 69.24 | 58.25 | 51.18 | -- |

Tom Moeller
AuthorMore in Author Profile »Prior to joining Haver Analytics in 2000, Mr. Moeller worked as the Economist at Chancellor Capital Management from 1985 to 1999. There, he developed comprehensive economic forecasts and interpreted economic data for equity and fixed income portfolio managers. Also at Chancellor, Mr. Moeller worked as an equity analyst and was responsible for researching and rating companies in the economically sensitive automobile and housing industries for investment in Chancellor’s equity portfolio. Prior to joining Chancellor, Mr. Moeller was an Economist at Citibank from 1979 to 1984. He also analyzed pricing behavior in the metals industry for the Council on Wage and Price Stability in Washington, D.C. In 1999, Mr. Moeller received the award for most accurate forecast from the Forecasters' Club of New York. From 1990 to 1992 he was President of the New York Association for Business Economists. Mr. Moeller earned an M.B.A. in Finance from Fordham University, where he graduated in 1987. He holds a Bachelor of Arts in Economics from George Washington University.
More Economy in Brief


