 Global| Apr 19 2007
U.S. Leading Indicator Weak
Summary
However, the signal for recession is not only a weakening in the LEI but also in the coincident index of economic indicators (COIN). The COIN is weakening only by a very small amount and at a very moderate pace, in effect blunting the [...]
| · The LEI is weak and faltering. One very reliable signal from the LEI is its year/year growth rate. Since the early 1960s, with one exception, significant year/year declines have foreshadowed the onset of recession. The sole exception was in 1966. Although in January 1996 a minor year/year reading of -0.1% also was recorded. Currently the LEI is off by 0.8% year/year – a worrisome signal. |
|---|
| LEADING | COINCIDENT | LAGGING | |
| Month-to-month | |||
| Mar-07 | 0.1% | 0.1% | 0.1% |
| Feb-07 | -0.6% | 0.2% | 0.2% |
| Jan-07 | -0.3% | -0.1% | 0.0% |
| Dec-06 | 0.6% | 0.3% | 0.7% |
| SAAR | |||
| 3-Mos | -2.9% | 1.0% | 0.9% |
| 6-Mos | -0.3% | 1.8% | 4.0% |
| 12-Mos | -0.8% | 1.7% | 3.2% |
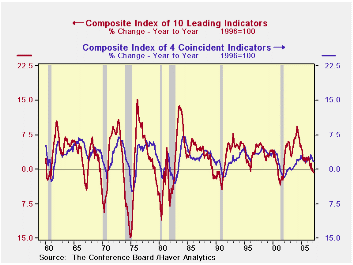
However, the signal for recession is not only a weakening in the LEI but also in the coincident index of economic indicators (COIN). The COIN is weakening only by a very small amount and at a very moderate pace, in effect blunting the weakening signal from the LEI itself…at least so far. 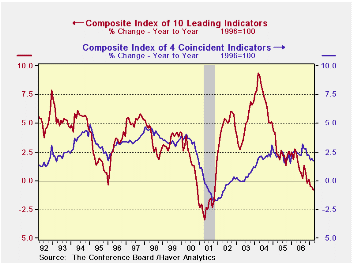
The blown up chart on the right allows closer inspection of the recent LEI and COIN trends. The ongoing and disturbing weakens in the LEI is clear, although its RATE OF DESCENT is not very pre-recession-like. The faltering in the COIN index after a spurt earlier in the year is also put in its less worrisome context, at least for the moment.
by Carol Stone April 19, 2007
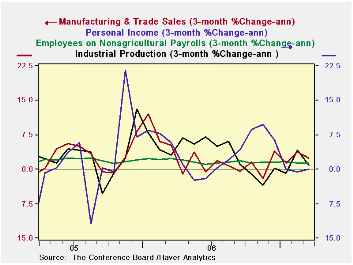
Moreover...if we look at short-term (3-month) growth rates of the COIN components, they still seem to be relatively firm. The coincident index does appear to be about to collapse. It seems still solid.
On balance what we have is evidence of ongoing weakness in the economy. The slippage of the year/year LEI growth rate, below zero and into negative territory, is very disturbing by itself given the reliability of that growth rate as a recession indicator. Yet the LEI itself is slipping at a very slow – almost slow-motion - speed compared to other pre-recession periods. More to the point, for recession to occur the coincident index must decline and the components of that index are showing no sign of doing that. The coincident index itself has undergone some slowing but the index is a product of its components and even three-month growth rates of its components still look quite solid.Verdict: worry but do not grieve for growth. A downturn still looks less than probable.
Philadelphia Index Remains Near Zeroby Robert Brusca April 19, 2007
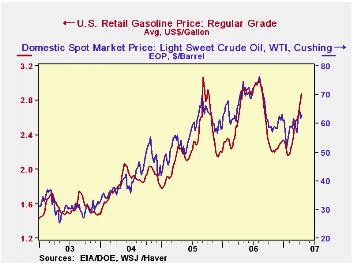
Gasoline prices are rising inexorably, surpassing $3.00/gallon in some high-tax areas by last week, and almost certainly due to cross that line imminently for the nation as a whole. In the week ended this past Monday, April 16, Department of Energy data put regular gasoline at $2.876 a gallon, up 7.4 cents on the week, following 9.5 and 9.7 cent increases the week of April 9 and April 2 respectively. The price is up 29.9 cents from four weeks ago. From the same week a year ago, the price is up 9.3 cents, or 3.3%.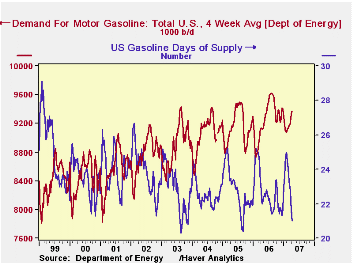
On Tuesday, the price of crude oil was $63.11 per barrel, up $1.21 from the week before and $6.37 from four weeks ago. However, the price is down from the extremes of the year-ago period, when the effects of Hurricane Katrina were still impacting availability.
Three weeks ago, when we last looked at these price patterns, we noted that prices were rebounded from a mid-winter lull. Then we cited the new information on the days' supply of gasoline inventories, which was lower at its winter peak than in prior years. Now we see that figure has dropped to 21.0 days, an unprecedentedly short period for the spring, ahead of the summer driving season. In fact, it's low for anytime, with only the Katrina period and the mid-summer of 2003 showing weaker supplies of gasoline relative to current demand.
This is likely related to calm weather and the reduced number of storms over the winter. According to the National Climate Data Center in figures released yesterday, the national average amount of precipitation in Q1 was the second smallest for that period since 1988. So people could drive more and they used more gasoline over the winter. The distinctive plunge in demand during those months of prior years was simply not repeated this year, as is clear in the second graph.
Meantime, data from the Oil and Gas Journal show that gasoline was above $3.00 in a number of cities by last week: San Francisco, Portland, San Diego and Chicago, most notably.
In this commentary, the data on gas prices, demand and inventories come from Haver's OILWKLY database. The price of crude oil is in WEEKLY, with another version of the same product also in OILWKLY and national average precipitation is in USECON. Most of the energy data is sourced from the Department of Energy, but gasoline prices in various cities are compiled by the Oil and Gas Journal publication.
| GASOLINE PRICES & DEMAND | 4/16/07 | 4/9/07 | 3/19/07 | 2/19/07 | 4/17/06 | Annual Averages||
|---|---|---|---|---|---|---|---|
| 2006 | 2005 | ||||||
| Retail Price, Regular Gasoline, $/gal | 2.876 | 2.802 | 2.577 | 2.296 | 2.783 | 2.572 | 2.270 |
| Spot Price, West Texas Intermediate, $/bbl | 63.11 | 61.90 | 56.74 | 58.08 | 71.36 | 66.10 | 56.47 |
| Gasoline Demand (000 b/d, 4-wk Avg)* |
9,365 | 9,363 | 9,178 | 9,121 | 9,134 | 9,259 | 9,146 |
| Inventory: Days' Supply* | 21.0 | 21.3 | 22.9 | 24.4 | 22.2 | 22.4 | 22.0 |
| · The table below contains the main elements of the Philadelphia Fed regional manufacturing index. At the far right another column introduces a different index. This index is what the Philadelphia Fed index would be if it used ISM weights. But Philadelphia does not do that. Instead, it has a separate survey on managers where they tell you how they feel. Recently they have been candidates for a new Excedrin™ headache number “XXX” commercial. |
|---|
| FAO-Index | |||||||||||
|---|---|---|---|---|---|---|---|---|---|---|---|
| Date | Current Index | Current New Orders | Current Shipment | Deliveries | Inventory | Backlog | Pr:Pd | Pr:Rcd | Current Employment | Worked Hours | INDEX Weighted |
| Apr-07 | 0.2 | 2.8 | 4.3 | -11.9 | -3.1 | -13.7 | 24.3 | 5.2 | 2.5 | 5.5 | -0.6 |
| Mar-07 | 0.2 | 1.9 | 6.8 | -13.2 | -3.7 | -20.9 | 21.8 | 16.3 | 2.3 | -4.9 | -1.2 |
| Feb-07 | 0.6 | -0.5 | 1.7 | -6.3 | -1.9 | -10.5 | 15.8 | 9.4 | -0.4 | -12.9 | -1.7 |
| Jan-07 | 8.3 | 1.3 | 23.9 | -7.1 | 0.4 | -15.4 | 11.9 | 11.6 | 7.9 | 1.8 | 5.3 |
| Dec-06 | -2.3 | -0.9 | 14 | -4.9 | -0.9 | -18.6 | 19 | 8.9 | 7.5 | -2.3 | 1.9 |
| Nov-06 | 5.4 | -1.1 | 7.8 | 1.8 | 5.3 | -5.5 | 25.2 | 7.4 | 3 | 2.3 | 2.2 |
| Oct-06 | 2.3 | 10.7 | 6.1 | -4.8 | 10.9 | -10.5 | 32.7 | 17.2 | 10.4 | -0.4 | 5.9 |
| Sep-06 | 2.3 | 0.2 | -4.4 | 0 | 4.7 | -3.8 | 37.8 | 20 | 10.3 | 5.4 | 0.6 |
| Aug-06 | 12.6 | 12.8 | 20.3 | 1.4 | 6.8 | -2 | 46.6 | 17.3 | 8.1 | 11.7 | 10.8 |
| Jul-06 | 6.5 | 9.9 | 10.7 | -1.3 | 0.5 | -6.5 | 49.5 | 17.6 | 11.7 | -2.4 | 6.7 |
| Jun-06 | 12.1 | 17.2 | 18.3 | 0.2 | -3.5 | -0.7 | 49.3 | 16 | 8.2 | 8.2 | 10.6 |
| May-06 | 13.6 | 3.5 | 14 | 9 | -5.3 | -2.8 | 53.9 | 11.3 | 2.9 | 9.6 | 5.1 |
| Apr-06 | 11.7 | 12 | 17.7 | -2.9 | -9.7 | 5.6 | 30.4 | 15.1 | 16.3 | 7.9 | 9.8 |
| Mar-06 | 12.9 | 21.1 | 23.2 | 2.5 | 11.6 | 4 | 22.5 | 15.7 | 7 | 7 | 15.0 |
| Feb-06 | 13.2 | 12.9 | 23.5 | 6.6 | 9.3 | 10 | 32.3 | 18 | 10.5 | 7 | 13.9 |
| Jan-06 | 6.4 | 11.5 | 19.5 | 7.8 | 6.6 | 0.3 | 40.2 | 20.3 | 11.8 | 7.4 | 11.6 |
| Dec-05 | 12.8 | 7.3 | 5 | 1.5 | 3.9 | 0.8 | 45.8 | 28.1 | 7.5 | 5.5 | 5.2 |
| Nov-05 | 10.7 | 13.2 | 21.5 | 5.7 | 3.8 | -8.2 | 53.9 | 31.8 | 18.4 | 12.4 | 12.2 |
| Oct-05 | 5.1 | 19.8 | 19 | 0 | -2 | -2.9 | 25.6 | 12.7 | 15.9 | -1.2 | 12.6 |
| Sep-05 | 8.8 | 1.3 | 16.2 | -0.7 | -0.9 | -8.6 | 50.5 | 6.6 | 3.9 | 2.6 | 4.0 |
| Aug-05 | 10.6 | 15 | 14.3 | -0.2 | -8 | 3.9 | 28.1 | 3.1 | 7 | 1 | 8.7 |
| Jul-05 | 10.1 | 7.2 | 12 | -1.3 | -8.7 | -8.1 | 30.4 | 13.1 | 2.4 | 5 | 3.7 |
| Jun-05 | -1.1 | 4.8 | 9.9 | -10.8 | -0.8 | -16 | 28.3 | 12.4 | 8.5 | 4.3 | 2.4 |
| May-05 | 9.1 | 16.5 | 18.8 | 0 | -0.9 | -3.6 | 31 | 16.5 | 8.7 | -0.7 | 10.5 |
| Apr-05 | 23.2 | 19.3 | 28.6 | 4.1 | 0 | -3.8 | 49.1 | 26.6 | 12.3 | 15.3 | 14.8 |
| Mar-05 | 14.1 | 15.3 | 15.5 | 1.3 | -2.4 | -3.3 | 33.9 | 18.1 | 12.2 | 8 | 9.9 |
| Feb-05 | 20.1 | 12.3 | 22.2 | 3.5 | -5.2 | -1.8 | 45 | 23.6 | 11.4 | 7 | 10.6 |
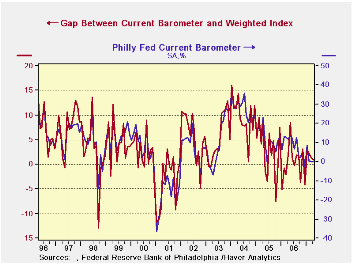
What is interesting is that the weighted Philly index and the barometer are related in particular way. The gap between the barometer and weighted index is a directional statement on the economy and functions similar to the Philly future index. On the left we plot the gap (the barometer less the weighted Philly values) vs the barometer itself.
You can see that gap between what managers say and what the index actually does tracks the direction of the index itself. In other words when managers are more optimistic they offer a barometer reading that is stronger than the component’s weight composite calls for. When conditions are getter weaker, they give a reading that is less buoyant relative to the surveyed components. It turns out that when managers are so pessimistic that the barometer reading is lower than the weighted reading it is a very bad sign for the economy. The good news is that we are not there yet. The bad news is that other Philadelphia measures have already crossed the line and are now worrisome in their degree of weakness.
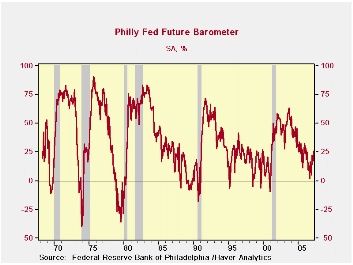
The Philadelphia Fed’s future barometer is a good example of what is disturbing. It has very regular cyclical properties, as you can see. Generally it turns negative before recession. Often it is actually rebounding even before the onset of recession or shortly after the onset of recession. In 2007 it is giving off all the recession signals except for having broken the zero line on the graph. However, we can form a second gap index for the future components just as did for current conditions. And that index performs just as the current conditions index performs. When plotted it has cut though the zero line and rebounded as it does in recession periods.
Next we show how the current gap indicator tracks the future barometer from the Philadelphia Fed. It is not too surprising that managers who respond to the survey are CONSISTENT in calling future conditions better at the same time they are evaluating current conditions to be better than their own assessment of the main business components at the time of survey.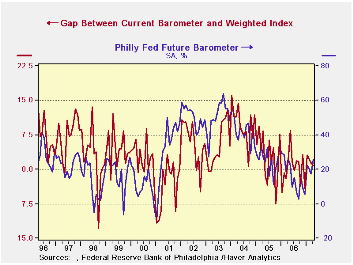
The point of all this discussion is to head off some of the criticism of this indicator. There are some economists who do not like it or trust it and think the Philadelphia survey is too small and too unreliable. But what is interesting about it is how the various components of the survey give off compatible signals and how those signals have been so closely correlated in the past with the cycles in the NATIONAL ECONOMY. It is and has been a better NATIONAL indicator than the ISM.
I have not been a pessimist about the prospects for this economy. But the Philadelphia Fed MFG survey with all its consistent slow-down signals is not giving us any room to be very optimistic. I also run a specific recession diagnostic off this index and it has been forecasting a national recession for several months running. That is not a finding that has found favor. The Philadelphia Fed survey has, using my method, been fighting off a recession signal starting back in March of 2005. It has turned that signal on and off several times since, but it now has six monthly recession signals in a row. Historically the lead time from this index’s signal to the onset of recession is 13 to 18 months. So we are touch longer than that from the first signal, but then signals are still in the offing.
Alan Greenspan has spoken of recession and called the probability about one-third and then said he thought that the economy would grow. Other economists have noted that a one-third probability of recession is not that high. But now I have this Philadelphia Fed index that is so persistent in emitting this signal that it is all a bit frightening. We also have persistent, but not yet deep weakness in the LEI (Leading economic Index). Jobless claims have recently ratcheted higher. While housing measures seem to have stabilized and job growth still seems at least firm (strong enough to drive the unemployment rate down!) the economy is indeed sending out some very mixed signals. If it were food it be Chinese: sweet and sour.
We have noted the wide disparity in the various regional indicators. Maybe Philadelphia is going to prove to be not so representative of the nation in 2006 and 2007 as it was in the past. But it is certainly giving off weak signals and there is nothing in the index to reassure us.
The Philadelphia barometer has been below the level of 9 for six months running. The orders index has not been above 2.8 in that period. Shipments have held up a lot better but they are still below the mid point of their normal range of values and well below their average and median readings. But employees hired and hours-worked are still above average and median norms. Job data are of course, notorious for lagging.
Even so…. what does not SMELL like recession about this report is– like the LEI- the fact that the rate of change is so slow. The Philadelphia Fed report says that the MFG economy is just sitting there and has been doing so for six months. Is this a regional problem or a national trend? Will manufacturing drag the economy down or will services hold it up? On this score I am still betting on services but recent economic reports have not been kind to this view. The regional disparities give us some reason to distrust the Philadelphia track record as a national bellwether. But we do that at our own risk. Remember, the famous last words are, ‘this time it will be different.’

Robert Brusca
AuthorMore in Author Profile »Robert A. Brusca is Chief Economist of Fact and Opinion Economics, a consulting firm he founded in Manhattan. He has been an economist on Wall Street for over 25 years. He has visited central banking and large institutional clients in over 30 countries in his career as an economist. Mr. Brusca was a Divisional Research Chief at the Federal Reserve Bank of NY (Chief of the International Financial markets Division), a Fed Watcher at Irving Trust and Chief Economist at Nikko Securities International. He is widely quoted and appears in various media. Mr. Brusca holds an MA and Ph.D. in economics from Michigan State University and a BA in Economics from the University of Michigan. His research pursues his strong interests in non aligned policy economics as well as international economics. FAO Economics’ research targets investors to assist them in making better investment decisions in stocks, bonds and in a variety of international assets. The company does not manage money and has no conflicts in giving economic advice.
More Economy in Brief


