 Global| Jan 24 2006
U.S. Leading Economic Indicators Rose, Signs of Excess Surfaced
by:Tom Moeller
|in:Economy in Brief
Summary
The composite index of leading economic indicators increased 0.3% last month after a downwardly revised no change during November, according to the Conference Board. October's gain also was revised away to a minus 0.1%. Consensus [...]
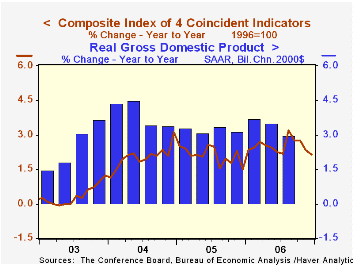
The composite index of leading economic indicators increased 0.3% last month after a downwardly revised no change during November, according to the Conference Board. October's gain also was revised away to a minus 0.1%. Consensus expectations had been for a 0.2% gain during December.
During the last ten years there has been a 59% correlation between the y/y change in the leading indicators and the lagged change in real GDP.
The lagging indicators rose a firm 0.9% after an upwardly revised 0.6% increase during November. December's gain was the largest increase since January of last year. It was led by higher C&I loans and a longer duration of unemployment. The ratio of coincident to lagging indicators, which is a measure of actual economic performance versus excess, fell sharply to the lowest level since late 2000.
The breadth of one month gain amongst the 10 components of the leading index improved sharply to 70%, its best since March, but over the last six months only 40% of the component series rose.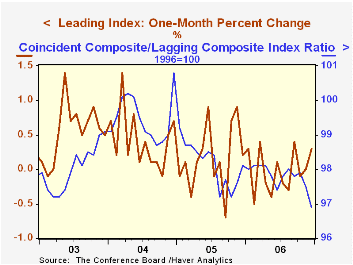
Lower initial claims for unemployment insurance, higher building permits and higher stock prices made the largest contributions to last month's gain in the leading index.
The method of calculating the contribution to the leading index from the spread between 10 year Treasury securities and the Fed funds rate has been revised. A negative contribution will now occur only when the spread inverts rather than when declining as in the past. More details can be found here.
The leading index is based on eight previously reported economic data series. Two series, orders for consumer goods and orders for capital goods, are estimated.
The coincident indicators increased 0.2% for the third straight month. Over the last ten years there has been a 91% correlation between the y/y change in the coincident indicators and real GDP growth.
Visit the Conference Board's site for coverage of leading indicator series from around the world.
| Business Cycle Indicators | December | November | Y/Y | 2006 | 2005 | 2004 |
|---|---|---|---|---|---|---|
| Leading | 0.3% | 0.0% | -0.1% | 1.2% | 2.5% | 7.1% |
| Coincident | 0.2% | 0.2% | 2.2% | 2.5% | 2.1% | 2.0% |
by Tom Moeller January 24, 2007
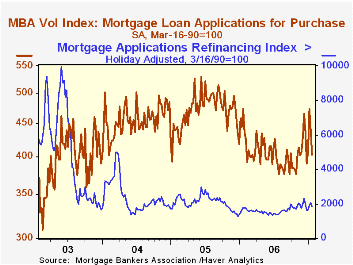
The total number of mortgage applications fell a sharp 8.4% last week, after a slight decline the prior week according to the Mortgage Bankers Association.
Purchase applications slumped 8.4% after the prior period's sharp 7.0% fall. Nevertheless, as a result of a 16.2% surge at the beginning of January, the average level of purchase applications this month is up 3.2% from December which rose 4.7%.
During the last ten years there has been a 58% correlation between the y/y change in purchase applications and the change in new plus existing single family home sales.
Applications to refinance also fell a sharp 9.6%. Applications to refinance in January are 2.0% above the December average which was unchanged from November.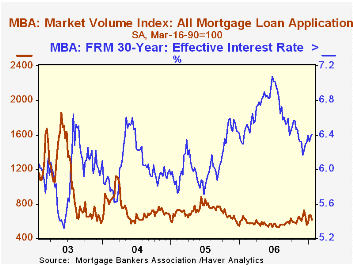
The effective interest rate on a conventional 30-year mortgage rose w/w to 6.41% to the highest level this year and compared to the December average of 6.28%. The peak for 30 year financing was 7.08% late in June. Rates for 15-year financing also rose to 6.19%. Interest rates on 15 and 30 year mortgages are closely correlated (>90%) with the rate on 10 year Treasury securities.
During the last ten years there has been a (negative) 79% correlation between the level of applications for purchase and the effective interest rate on a 30-year mortgage.
The Mortgage Bankers Association surveys between 20 to 35 of the top lenders in the U.S. housing industry to derive its refinance, purchase and market indexes. The weekly survey covers roughly 50% of all U.S. residential mortgage applications processed each week by mortgage banks, commercial banks and thrifts. Visit the Mortgage Bankers Association site here.
| MBA Mortgage Applications (3/16/90=100) | 01/19/07 | 01/12/07 | Y/Y | 2006 | 2005 | 2004 |
|---|---|---|---|---|---|---|
| Total Market Index | 611.3 | 667.2 | -7.4% | 584.2 | 708.6 | 735.1 |
| Purchase | 402.7 | 439.7 | -15.0% | 406.9 | 470.9 | 454.5 |
| Refinancing | 1,848.8 | 2,045.8 | 4.2% | 1,634.0 | 2,092.3 | 2,366.8 |
by Carol Stone January 24, 2006
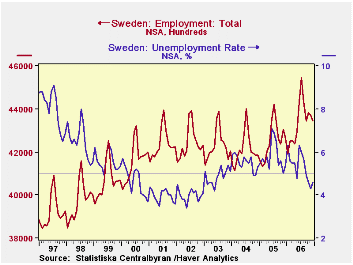
Sweden's labor market conditions were favorable during 2006, with growth in employment and declining unemployment. The December labor force survey, reported today by Statistics Sweden, shows growth in the labor force of 1.1% year/year and growth in employment of 1.9%. The unemployment rate was 4.6%, the fourth consecutive month below 5% and down markedly from 5.4% in December 2005.
For the year as a whole, employment expanded by 2.0%, the best performance since before dot.com-related recessionary conditions struck Sweden in late 2001. The employment rate was 74.3%, up from 73.7% in December 2005 and the highest December since 2001.
Sweden's labor force data were harmonized with the rest of the EU beginning in April 2005. Earlier data were not restated. So historical comparisons are a bit tenuous. Even so, the growth in employment is a genuine and positive development for the nation's economy and its people.
| SWEDEN: NSA (000s) | Dec 2006 | Nov 2006 | Dec 2005* | 2006 | 2005* | 2004* |
|---|---|---|---|---|---|---|
| Labor Force | 4,556 | 4,568 | 4,508 | 4,586 | 4,517 | 4,459 |
| Yr/Yr % Change | 1.1% | 0.8% | 2.0% | 1.5% | 1.3% | 0.2% |
| Employment | 4,345 | 4,370 | 4,264 | 4,340 | 4,254 | 4,213 |
| Yr/Yr % Change | 1.9% | 1.5% | 1.9% | 2.0% | 1.0% | -0.4% |
| Unemployment Rate (%) | 4.6% | 4.3% | 5.4% | 5.3% | 5.8% | 5.5% |
by Carol Stone January 24, 2006
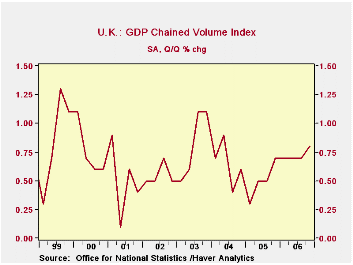
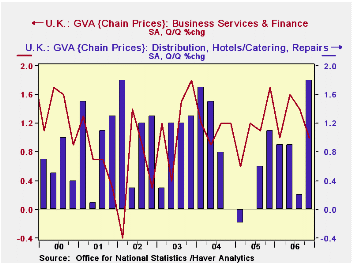
GDP in the UK gained 0.8% in Q4, the largest quarterly increase in 2-1/2 years, according to preliminary data reported today by the Office for National Statistics. The pick-up from 0.7% in Q3 occurred in the services sector. Contrary to at least one press report, this did not happen in the financial industries. Instead it was in old-line, traditional activities, including wholesale and retail trade, hotels and restaurants, and transportation and communications; these surged from marginal increases in Q3 to 1.4-1.8% in Q4. Finance and business services were hardly slow, at 1.0% growth in Q4, but they had been stronger at 1.3-1.4% earlier in the year.
Manufacturing had three firm quarter running, but came to a dead halt in Q4, with virtually no change at all. Even so, this put Q4/Q4 at 2.3%, the strongest since 1999. The mining sector (which includes oil production) stabilized after two quarters of steep decline, while utility output continued to contract. In fact, electricity, gas and water supply fell 5.2% Q4/Q4 and 3.2% for 2006 as a whole, the weakest performance since the massive coal miners' strike in 1984.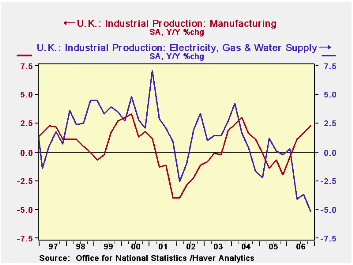
| UK GDP SA, % Changes | Q4 2006 "Prel" | Q3 2006 | Q2 2006 | Year/Year | 2006 | 2005 | 2004 | 2003 |
|---|---|---|---|---|---|---|---|---|
| GDP | 0.8 | 0.7 | 0.7 | 3.0 | 2.7 | 2.0 | 3.2 | 2.6 |
| Manufacturing | 0.0 | 0.6 | 0.9 | 2.3 | 1.2 | -1.1 | 2.0 | 0.2 |
| Mining inc Oil Extraction | -0.1 | -3.8 | -3.7 | -7.6 | -8.0 | -8.7 | -7.9 | -5.1 |
| Electricity, Gas & Water Supply | -2.3 | -0.2 | -2.7 | -5.2 | -3.2 | 0.3 | 1.2 | 1.6 |
| Services | 1.0 | 0.8 | 1.0 | 3.6 | 3.7 | 2.9 | 3.9 | 3.1 |
Tom Moeller
AuthorMore in Author Profile »Prior to joining Haver Analytics in 2000, Mr. Moeller worked as the Economist at Chancellor Capital Management from 1985 to 1999. There, he developed comprehensive economic forecasts and interpreted economic data for equity and fixed income portfolio managers. Also at Chancellor, Mr. Moeller worked as an equity analyst and was responsible for researching and rating companies in the economically sensitive automobile and housing industries for investment in Chancellor’s equity portfolio. Prior to joining Chancellor, Mr. Moeller was an Economist at Citibank from 1979 to 1984. He also analyzed pricing behavior in the metals industry for the Council on Wage and Price Stability in Washington, D.C. In 1999, Mr. Moeller received the award for most accurate forecast from the Forecasters' Club of New York. From 1990 to 1992 he was President of the New York Association for Business Economists. Mr. Moeller earned an M.B.A. in Finance from Fordham University, where he graduated in 1987. He holds a Bachelor of Arts in Economics from George Washington University.


