 Global| Mar 20 2008
U.S. Leading Economic Indicators Fell For Fifth Month
by:Tom Moeller
|in:Economy in Brief
Summary
The Conference Board reported that the composite index of leading economic indicators fell 0.3% last month and matched Consensus expectations. A January decline of 0.1% reported initially was revised to show a larger 0.4% drop. It was [...]
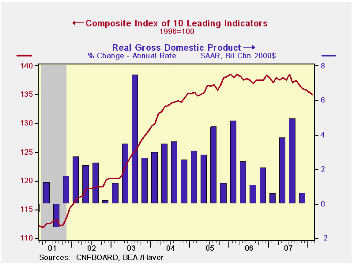
The Conference Board reported that the composite index of leading economic indicators fell 0.3% last month and matched Consensus expectations. A January decline of 0.1% reported initially was revised to show a larger 0.4% drop. It was the fifth consecutive monthly decline.
During the last ten years there has been a 59% correlation between the y/y change in the leading indicators index and the lagged change in real GDP.
The breadth of one month increase amongst the 10 components of the leading index remained at the January level of 45%. Over a six month period, the breadth of gain amongst the leaders components remained at 20%, the lowest level since 2002.
Last month higher claims for jobless insurance, lower building permits, faster vendor performance and lower stock prices made the largest negative contributions to the overall leading index.
The method of calculating the contribution to the leading
index from the spread between 10 year Treasury securities and the Fed
funds rate has been revised. A negative contribution will now occur
only when the spread inverts rather than when declining as in the past.
More details can be found here.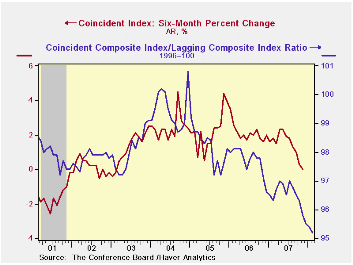
The leading index is based on eight previously reported economic data series. Two series, orders for consumer goods and orders for capital goods, are estimated.
The coincident indicators were unchanged for the third consecutive month. Over the last ten years there has been an 86% correlation between the y/y change in the coincident indicators and real GDP growth. Half of the coincident series components fell.
The lagging index rose slightly as the average duration of unemployment rose and C&I loans increased. The ratio of coincident to lagging indicators (a measure of economic excess) fell yet again and was at its lowest since 1982.
Visit the Conference Board's site for coverage of leading indicator series from around the world.
On the Needed Quantity of Government Debt from the Federal Reserve Bank of Minneapolis is available here.
| Business Cycle Indicators | February | January | Y/Y | 2007 | 2006 | 2005 |
|---|---|---|---|---|---|---|
| Leading | -0.3% | -0.4% | -1.5% | -0.4% | 1.2% | 2.5% |
| Coincident | 0.0% | 0.0% | 1.1% | 1.8% | 2.5% | 2.1% |
| Lagging | 0.2% | 0.1% | 2.3% | 3.1% | 3.0% | 3.5% |
by Tom Moeller March 20, 2008
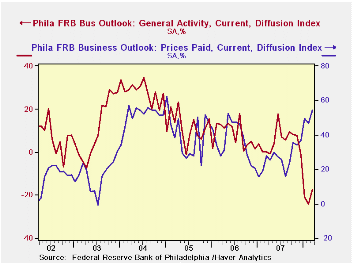
The Philadelphia Federal Reserve Bank reported that for March, it's Index of General Business Conditions in the manufacturing sector improved slightly to -17.4, about as expected, from -24.0 in February. The latest level was still near the lowest since the recession year 2001.
The Philadelphia Fed constructs a diffusion index for total business activity and each of the sub indexes. The business conditions index reflects a separate survey question, not the sub indexes listed below.
During the last ten years there has been a 59% correlation
between the level of the Philadelphia Fed Business Conditions Index and
the three-month growth in factory sector industrial production. There
has been a 42% correlation with q/q growth in real GDP.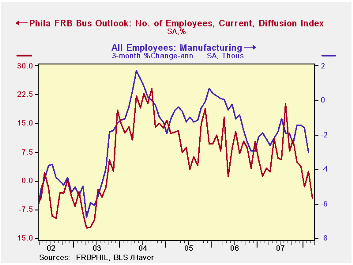
The modest rise in the overall index reflected slight improvement in the new orders and in the shipments sub indexes. Unfilled orders, delivery times and inventories continued to fall, as did the employment index which fell to its lowest since 2003. During the last ten years there has been a 75% correlation between the employment index and the three-month growth in factory payrolls.
The prices paid index rose sharply to its highest level since January 2005. During the last ten years there has been a 76% correlation between the prices paid index and the three-month growth in the intermediate goods PPI. There has been an 85% correlation with the change in core intermediate goods prices.
The separate index of expected business conditions in six months rose and recovered most of a sharp February decline, but the index still remained negative. Expectations for new orders, shipments and for the number of employees each recovered some of the sharp February declines.
The latest Business Outlook Survey from the Federal Reserve Bank of Philadelphia can be found here.
| March | February | March '07 | 2007 | 2006 | 2005 | |
|---|---|---|---|---|---|---|
| General Activity Index | -17.4 | -24.0 | 0.2 | 5.1 | 8.1 | 11.5 |
| Prices Paid Index | 54.4 | 46.6 | 27.6 | 26.4 | 36.6 | 40.1 |
by Tom Moeller March 20, 2008
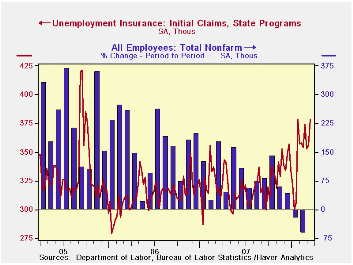
Initial claims for unemployment insurance last week surged 22,000 to 378,000. The latest was the highest level since September 2005 and claims during the prior week were revised up slightly. Consensus expectations had been for initial claims last week to rise just slightly to 359,000. So far in March claims have averaged 367,000, up 2.2% from the February average.
The latest weekly claims figure will be used by the Labor
Department to survey March nonfarm payrolls. Claims rose 24,000 (6.8%)
from the February survey period. 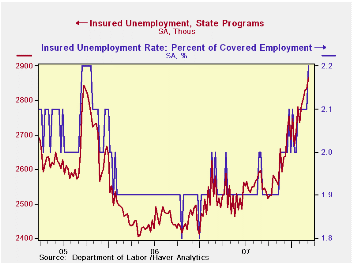
A claims level below 400,000 typically has been associated with growth in nonfarm payrolls. During the last ten years there has been a (negative) 76% correlation between the level of initial claims and the m/m change in nonfarm payroll employment.
The four week moving average of initial claims rose to 365,250 (12.7% y/y), also the highest since 2005.
Continuing claims for unemployment insurance rose a strong 32,000 (1.1%) during the latest week. That followed a 4,000 rise, which was revised down just slightly, during the prior period. Insured unemployment stood at its highest level since August 2004. The figure provides some indication of workers' ability to find employment.
The continuing claims numbers lag the initial claims figures by one week.
The insured rate of unemployment rose to 2.2%, its highest level since October 2005.
No Volatility, No Forecasting Power for the Term Spread from the Federal Reserve Bank of St. Louis can be found here.
| Unemployment Insurance (000s) | 03/15/08 | 03/08/08 | Y/Y | 2007 | 2006 | 2005 |
|---|---|---|---|---|---|---|
| Initial Claims | 378 | 356 | 18.9% | 322 | 313 | 331 |
| Continuing Claims | -- | 2,835 | 9.8% | 2,551 | 2,459 | 2,662 |
by Robert Brusca March 20, 2008
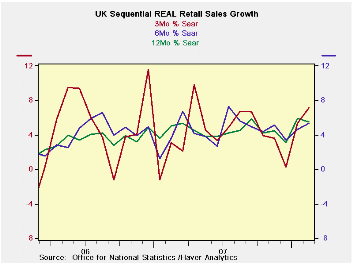 UK retail sales surged in
February quite unexpectedly. Sales
popped by 1.2% in nominal terms and by 0.9% inflation adjusted ex-autos
Real sales ex autos are now up a strong 5.1% from one-year ago while
nominal sales overall are up 4.7%.
UK retail sales surged in
February quite unexpectedly. Sales
popped by 1.2% in nominal terms and by 0.9% inflation adjusted ex-autos
Real sales ex autos are now up a strong 5.1% from one-year ago while
nominal sales overall are up 4.7%.
In the quarter to date Real Retail Sales ex Autos are rising at a 9.8% annual rate. Nominal overall retails ales are up at am 11.4% pace. Sales are off to a terrific start in Q1.
January and February sales are not quite strong a sharp turnaround from the drop in Sales in December. Whereas once the UK economy seemed to be floundering, now strength has emerged in several areas, most recently in retailing. At the same time, the inflation readings have become more nettlesome. All bets are off as far as what the BOE does next and when.
| UK Real and Nominal Retail Sales | |||||||
|---|---|---|---|---|---|---|---|
| Nominal | Feb-08 | Jan-08 | Dec-07 | 3-MO | 6-MO | 12-MO | YrAGo |
| Retail Total | 1.2% | 1.2% | -0.7% | 7.3% | 5.5% | 5.0% | 4.7% |
| Food Beverage & Tobacco | 1.2% | 1.1% | 0.2% | 10.7% | 8.2% | 6.4% | 3.9% |
| Clothing footwear | 2.6% | 0.4% | 0.4% | 13.9% | 5.0% | 3.6% | 6.9% |
| Real | |||||||
| Retail Ex Auto | 0.9% | 1.1% | -0.3% | 7.1% | 5.3% | 5.5% | 5.1% |
by Robert Brusca March 20, 2008
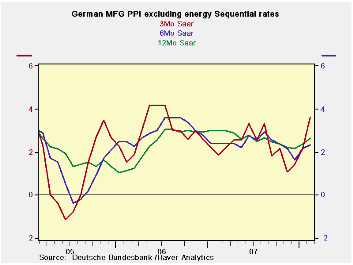 German ex-energy MFG prices
are showing pressure with
three-month inflation surging and pushing up the pace across the major
tenor comparisons. Headline MFG price inflation is in the 5% to 6%
range over three and six months. It is still at 3.7% year/year much
more than its year/year pace of 2.9% one year ago. Inflation’s
acceleration is deeply rooted for the MFG headline rate.Ex-energy
prices have less of a
structural problem and more of a rising cyclical issue. Year/year
ex-energy inflation is at 2.6%. A year ago ex-energy inflation was
stronger at 3%; ex-energy inflation decelerated further to 2.3% over
six months. But the recent three-month pace at 3.6% is a decided
acceleration. As you can see on the chart this is a reversal of a
decelerating trend that had been in place. January and February
ex-energy price have brought more pressure. This is going to be
disconcerting to the ECB that is worried about second round effects on
inflation.
German ex-energy MFG prices
are showing pressure with
three-month inflation surging and pushing up the pace across the major
tenor comparisons. Headline MFG price inflation is in the 5% to 6%
range over three and six months. It is still at 3.7% year/year much
more than its year/year pace of 2.9% one year ago. Inflation’s
acceleration is deeply rooted for the MFG headline rate.Ex-energy
prices have less of a
structural problem and more of a rising cyclical issue. Year/year
ex-energy inflation is at 2.6%. A year ago ex-energy inflation was
stronger at 3%; ex-energy inflation decelerated further to 2.3% over
six months. But the recent three-month pace at 3.6% is a decided
acceleration. As you can see on the chart this is a reversal of a
decelerating trend that had been in place. January and February
ex-energy price have brought more pressure. This is going to be
disconcerting to the ECB that is worried about second round effects on
inflation.
| Germany PPI | |||||||
|---|---|---|---|---|---|---|---|
| %m/m | %-SAAR | ||||||
| Feb-08 | Jan-08 | Dec-07 | 3-mo | 6-mo | 12-mo | 12-moY-Ago | |
| MFG | 0.6% | 0.5% | 0.2% | 5.0% | 6.0% | 3.7% | 2.9% |
| Ex Energy | 0.4% | 0.4% | 0.1% | 3.6% | 2.3% | 2.6% | 3.0% |

Tom Moeller
AuthorMore in Author Profile »Prior to joining Haver Analytics in 2000, Mr. Moeller worked as the Economist at Chancellor Capital Management from 1985 to 1999. There, he developed comprehensive economic forecasts and interpreted economic data for equity and fixed income portfolio managers. Also at Chancellor, Mr. Moeller worked as an equity analyst and was responsible for researching and rating companies in the economically sensitive automobile and housing industries for investment in Chancellor’s equity portfolio. Prior to joining Chancellor, Mr. Moeller was an Economist at Citibank from 1979 to 1984. He also analyzed pricing behavior in the metals industry for the Council on Wage and Price Stability in Washington, D.C. In 1999, Mr. Moeller received the award for most accurate forecast from the Forecasters' Club of New York. From 1990 to 1992 he was President of the New York Association for Business Economists. Mr. Moeller earned an M.B.A. in Finance from Fordham University, where he graduated in 1987. He holds a Bachelor of Arts in Economics from George Washington University.
More Economy in Brief


