 Global| Feb 21 2008
U.S. Leading Economic Indicators Down
by:Tom Moeller
|in:Economy in Brief
Summary
For January, the Conference Board reported that the composite index of leading economic indicators fell 0.1% after a revised 0.1% decline during December. The latest drop matched Consensus expectations. It was the fifth decline in the [...]
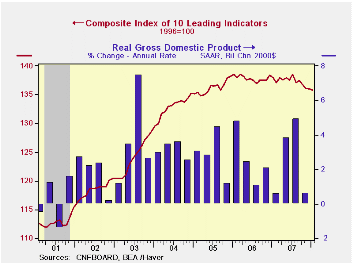
For January, the Conference Board reported that the composite index of leading economic indicators fell 0.1% after a revised 0.1% decline during December. The latest drop matched Consensus expectations. It was the fifth decline in the last six months and since the series' peak last July it has fallen 2.0%.
For all of last year the leaders fell 0.4% and the six month growth rate, calculated as the latest month's reading divided by the average of the prior twelve months, was -4.0%, the lowest since early 2001.
During the last ten years there has been a 59% correlation
between the y/y change in the leading indicators index and the lagged
change in real GDP.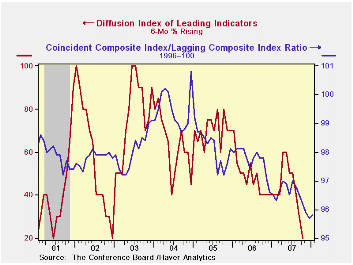
The breadth of one month gain amongst the 10 components of the leading index rose slightly to a break even 50.0%. Over a six month period, the breadth of gain amongst the leaders components cratered to 20%, equal to its lowest level since 2002.
Last month lower stock prices made the largest contribution to the decline in the overall leading index.
The method of calculating the contribution to the leading index from the spread between 10 year Treasury securities and the Fed funds rate has been revised. A negative contribution will now occur only when the spread inverts rather than when declining as in the past. More details can be found here.
The leading index is based on eight previously reported economic data series. Two series, orders for consumer goods and orders for capital goods, are estimated.
The coincident indicators rose 0.1% after a 0.1% December uptick. Over the last ten years there has been an 86% correlation between the y/y change in the coincident indicators and real GDP growth. Three of the four coincident series components rose very slightly and employment fell.
The lagging index was unchanged and the ratio of coincident to lagging indicators (a measure of economic excess) ticked up slightly but remained near its lowest since 1991.
Visit the Conference Board's site for coverage of leading indicator series from around the world.
| Business Cycle Indicators | January | December | Y/Y | 2007 | 2006 | 2005 |
|---|---|---|---|---|---|---|
| Leading | -0.1% | -0.1% | -1.5% | -0.4% | 1.2% | 2.5% |
| Coincident | 0.1% | 0.1% | 1.5% | 1.8% | 2.5% | 2.1% |
| Lagging | 0.0% | 0.2% | 2.3% | 3.1% | 3.0% | 3.5% |
by Tom Moeller February 21, 2008
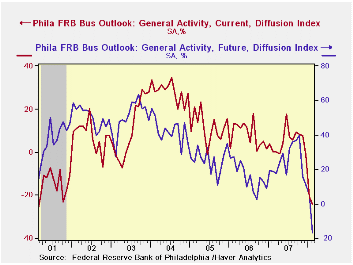
The Philadelphia Federal Reserve Bank reported that it's Index of General Business Conditions in the manufacturing sector fell to -24.0 this month from -20.9 in January. The latest level was the lowest since the recession year 2001.
The index is a diffusion index for each component or series. It reflects the increase in activity reported less the decrease.
During the last ten years there has been a 59% correlation
between the level of the Philadelphia Fed Business Conditions Index and
the three-month growth in factory sector industrial production. There
has been a 42% correlation with q/q growth in real GDP.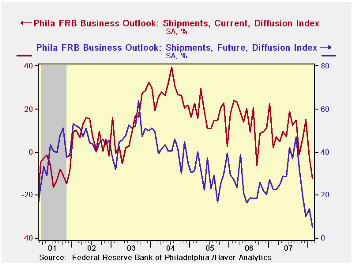
The decline in the overall index represented broad based declines in each of the sub indexes except new orders and the number of employees which ticked up. During the last ten years there has been a 75% correlation between the employment index and the three-month growth in factory payrolls.
The business conditions index reflects a separate survey question, not the sub indexes.
The prices paid index also fell slightly after strong up moves during the prior five months. During the last ten years there has been a 76% correlation between the prices paid index and the three-month growth in the intermediate goods PPI. There has been an 85% correlation with the change in core intermediate goods prices.
The separate index of expected business conditions in six months fell sharply to the lowest reading since 1990. Expectations for new orders, shipments and for the number of employees fell sharply.
Are Shocks to the Terms of Trade, Shocks to Productivity? from the Federal Reserve Bank of Minneapolis can be found here.
| February | January | Feb. '07 | 2007 | 2006 | 2005 | |
|---|---|---|---|---|---|---|
| General Activity Index | -24.0 | -20.9 | 0.3 | 5.1 | 8.1 | 11.5 |
| Prices Paid Index | 46.6 | 49.8 | 18.8 | 26.4 | 36.6 | 40.1 |
by Tom Moeller February 21, 2008
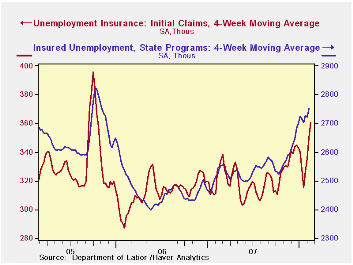
Initial claims for unemployment insurance fell 9,000 to 349,000 last week, but the prior week's level was revised up sharply. For February, claims so far are up 28,000, or 8.6%, from the January average. The latest weekly level remained near the highest since October of 2005.
The four-week moving average of initial claims, a measure
which smoothes out most of the series' w/w volatility, rose again to
360,500 (+9.2% y/y), the highest level since Summer of 2005.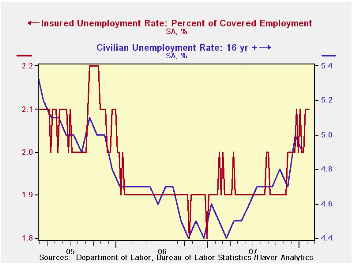
A claims level below 400,000 typically has been associated with growth in nonfarm payrolls. During the last ten years there has been a (negative) 76% correlation between the level of initial claims and the m/m change in nonfarm payroll employment.
Continuing claims for unemployment insurance rose 48,000 and reversed a 48,000 decline during the prior week. That decline was much deeper than reported initially. Insured unemployment stood at its highest level since Summer 2005. The figure provides some indication of workers' ability to find employment.
The continuing claims numbers lag the initial claims figures by one week.
The insured rate of unemployment remained at 2.1% for the third consecutive week.
Minutes to the January meeting of the Federal Open Market Committee can be found here.
Recent Trends in Economic Volatility: Conference Summary from the Federal Reserve Bank of San Francisco is available here.
| Unemployment Insurance (000s) | 02/16/08 | 02/09/08 | Y/Y | 2006 | 2005 | 2004 |
|---|---|---|---|---|---|---|
| Initial Claims | 349 | 358 | 4.8% | 313 | 331 | 343 |
| Continuing Claims | -- | 2,784 | 11.5% | 2,459 | 2,662 | 2,924 |
by Robert Brusca February 21, 2008
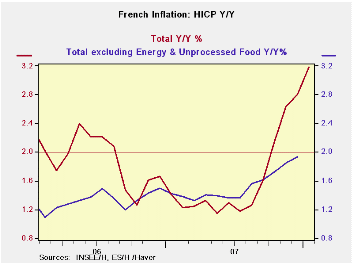
French inflation is showing pressure. In January the Yr/Yr
HICP pace is up to 3.2% from 1.4% in the previous 12-month period. The
CPI excl food and energy rate is up to 2% from 1.4% a year ago. The
3-month CPI excl food and energy pace is a bit lower than it was over
six months, but it is still above the 2% mark. While the main CPI
categories show that 90% of them have inflation higher than it was a
year ago, 72% have higher inflation over six months that over 12-months
but only 54% have higher inflation over three months than over
6-months, Clothing and Communications inflation is cooling the fastest.
Education plus food and energy intensive categories show the most
inflation pressure.
| France HICP and CPI details | |||||||
|---|---|---|---|---|---|---|---|
| Mo/Mo % | Saar % | Yr/Yr | |||||
| Jan-08 | Dec-07 | Nov-07 | 3-Mo | 6-Mo | 12-Mo | Yr Ago | |
| HICP Total | 0.3% | 0.4% | 0.7% | 5.9% | 4.6% | 3.2% | 1.4% |
| Core | -- | 0.3% | 0.3% | -- | -- | -- | 1.4% |
| CPI | |||||||
| All | 0.4% | 0.3% | 0.6% | 5.4% | 4.0% | 2.9% | 1.3% |
| CPI excl Food and Energy | 0.2% | 0.2% | 0.2% | 2.6% | 2.8% | 2.0% | 1.4% |
| Food | 1.2% | 0.6% | 0.4% | 8.8% | 8.1% | 4.4% | 1.7% |
| Alcohol | 0.1% | 0.1% | 0.3% | 1.8% | 7.0% | 4.5% | 0.6% |
| Clothing & Shoes | -0.7% | 0.1% | 0.0% | -2.0% | 0.2% | 0.6% | 0.1% |
| Rent & Utilities | 0.5% | 0.6% | 1.1% | 9.0% | 6.7% | 4.7% | 3.3% |
| Health Care | 0.1% | -0.1% | 0.0% | 0.0% | 0.4% | 0.3% | 0.3% |
| Transport | 0.1% | 1.0% | 1.9% | 13.0% | 7.7% | 6.1% | 0.9% |
| Communication | -0.4% | -0.3% | 0.0% | -2.8% | 0.2% | -1.2% | -1.6% |
| Recreation & Culture | 0.0% | -0.3% | 0.2% | -0.6% | -1.6% | -1.3% | -1.8% |
| Education | 0.5% | 0.2% | 0.6% | 5.1% | 3.4% | 3.0% | 2.5% |
| Restaurant & Hotel | 0.4% | 0.3% | 0.2% | 3.3% | 2.5% | 2.8% | 2.7% |
| Other | 0.0% | 0.2% | 0.2% | 1.3% | 1.9% | 1.9% | 2.7% |
| Diffusion | -- | -- | -- | 54.5% | 72.7% | 90.9% | -- |
| Type: | Diffusion: Compared to | 6-mo | 12-mo | Yr-Ago | -- | ||

Tom Moeller
AuthorMore in Author Profile »Prior to joining Haver Analytics in 2000, Mr. Moeller worked as the Economist at Chancellor Capital Management from 1985 to 1999. There, he developed comprehensive economic forecasts and interpreted economic data for equity and fixed income portfolio managers. Also at Chancellor, Mr. Moeller worked as an equity analyst and was responsible for researching and rating companies in the economically sensitive automobile and housing industries for investment in Chancellor’s equity portfolio. Prior to joining Chancellor, Mr. Moeller was an Economist at Citibank from 1979 to 1984. He also analyzed pricing behavior in the metals industry for the Council on Wage and Price Stability in Washington, D.C. In 1999, Mr. Moeller received the award for most accurate forecast from the Forecasters' Club of New York. From 1990 to 1992 he was President of the New York Association for Business Economists. Mr. Moeller earned an M.B.A. in Finance from Fordham University, where he graduated in 1987. He holds a Bachelor of Arts in Economics from George Washington University.
More Economy in Brief


