 Global| May 19 2008
U.S. Leading Economic Indicators Again Up Slightly
by:Tom Moeller
|in:Economy in Brief
Summary
The composite index of leading economic indicators, reported by the Conference Board, increased 0.1% last month after an unrevised 0.1% uptick in March. Consensus expectations had been for no change in the April leaders and the latest [...]
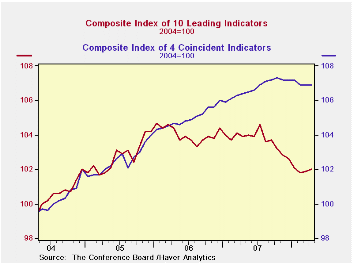
The composite index of leading economic indicators, reported by the Conference Board, increased 0.1% last month after an unrevised 0.1% uptick in March. Consensus expectations had been for no change in the April leaders and the latest two gains followed consecutive declines during the five prior months.
The leaders may not yet indicate that the U.S. economy is entering recession. Since their peak in early 2006, the leading index has fallen 2.6%. Prior to the recession of 2001 the leading index declined a greater 3.7% over a shorter, roughly ten month span.
During the last ten years there has been a 59% correlation between the y/y change in the leading indicators index and the lagged change in real GDP.
The breadth of one month increase amongst the leaders' 10
components improved to 65% after its revised 50% breadth of March gain.
Over a six month period the breadth of gain amongst the leaders'
components also improved moderately but remained quite low at 40%.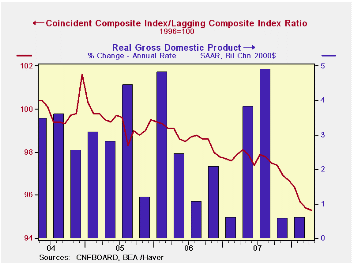
Last month higher building permits, stock prices, a more positively sloped yield curve and lower claims for unemployment insurance made the largest positive contributions to the leader's rise. These gains were offset by lower weekly hours worked and lower consumer expectations.
The method of calculating the contribution to the leading index from the spread between 10 year Treasury securities and the Fed funds rate has been revised. A negative contribution will now occur only when the spread inverts rather than when declining as in the past. More details can be found here.
The leading index is based on eight previously reported economic data series. Two series, orders for consumer goods and orders for capital goods, are estimated.
The coincident indicators were unchanged for the second month in the last five. Over the last ten years there has been an 86% correlation between the y/y change in the coincident indicators and real GDP growth. Half of the coincident series components fell last month and the series is down 0.4% from its October peak.
The lagging index ticked up 0.1% after two months of 0.4% increase. The ratio of coincident to lagging indicators (a measure of economic excess) fell and was at its lowest since early 1991.
Visit the Conference Board's site for coverage of leading indicator series from around the world.
Credit Access, Labor Supply, and Consumer Welfare from the Federal Reserve Bank of Richmond can be found here.
| Business Cycle Indicators | April | March | Jan., 6 Month % (AR) | 2007 | 2006 | 2005 |
|---|---|---|---|---|---|---|
| Leading | 0.1% | 0.1% | -2.3% | -0.4% | 1.3% | 2.7% |
| Coincident | 0.0% | 0.0% | -0.7% | 1.7% | 2.4% | 2.5% |
| Lagging | 0.1% | 0.4% | 3.7% | 2.9% | 3.1% | 3.1% |
by Robert Brusca May 19, 2008
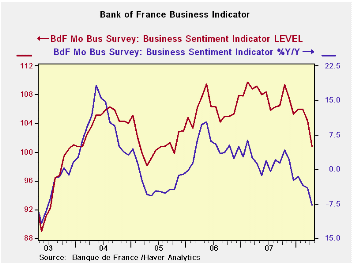
The Bank of France indicator for industry stands near the bottom quartile of its two-year range and is beginning to break more decidedly lower (see chart). The production index is at a 2-Yr low. Overall order books are the weakest they have been in two years. Job market readings for current and expected conditions are near mid-range.
For French production the weakest sector is agriculture and food. Production in the consumer goods sector is in the bottom quartile of its range. Capital goods is an enduring exception with production near the top third of its range. The capital goods sector continues to the firmest sector among most e-Zone countries.
The performance of orders by sector is approximately the same as it is for production with food very weak. The consumer sector also is weak and stands very low in its two year range; capital goods orders again are in the top third of their range.
On balance the Bank of France Survey agrees with the notion that the e-Zone is slowing. Food and consumer goods are the weakest sectors with capital goods being dragged lower, but still showing relatively firm readings for now.
| Bank of France Monthly INDUSTRY Survey: SUMMARY | ||||||
|---|---|---|---|---|---|---|
| 12 MO | Since Jan-87 | 2Yr Percentile | ||||
| Apr-08 | Mar-08 | Feb-08 | AVERAGE | Average | rank/range | |
| Production-latest month | ||||||
| Total Industry | 3.36 | 0.35 | 3.71 | 6 | 7 | 26.2% |
| Production Outlook | ||||||
| Total Industry | 5.45 | 13.2 | 12.26 | 16 | 15 | 0.0% |
| Demand | ||||||
| Overall order books | 17.64 | 18.24 | 22.11 | 25 | 5 | 0.0% |
| Foreign Orders | 9.7 | 2.39 | 9.81 | 10 | 8 | 30.6% |
| New Orders | ||||||
| Total Industry | 8.95 | 1.36 | 8.3 | 9 | 9 | 37.1% |
| Stocks: Finished Goods | ||||||
| Total Industry | 0.63 | 0.62 | -3.21 | -2 | -2 | 93.2% |
| Capacity Utilization | 83.15 | 83.12 | 83.33 | 83 | 83 | 48.2% |
| Hiring | ||||||
| Latest Month | -0.4 | -2.68 | 0.14 | 0 | -1 | 51.6% |
| Outlook | -2.81 | -3.81 | -0.49 | -2 | -3 | 53.7% |
| Industry Sentiment Index | 100.81 | 104.29 | 105.99 | 106 | 107 | 0.0% |
by Louise Curley May 19, 2008
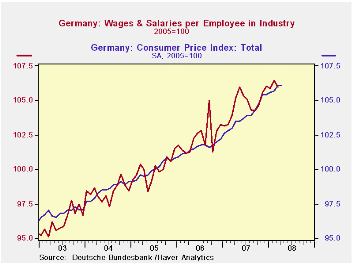
After rising sharply from 1% in September, inflation in Germany has moderated somewhat. In April 2008 it dropped to 2.41% from 3.10% in March. So far, inflation has not been a serious threat to the economy. Indexes (2005=100) of compensation of labor and the CPI, are shown in the first chart. Compensation has generally managed to exceed inflation, as a result real wages have advanced moderately.
From the standpoint of business, wage growth has been below
the growth in productivity so that unit labor costs have continued to
decline, as can be seen in the second chart. Since the unit labor cost
data are available only quarterly, the monthly wage and productivity
data are aggregated to a quarterly basis. The latter are available for
the first quarter of 2008, while the ULC data are only available for
the fourth quarter of 2007.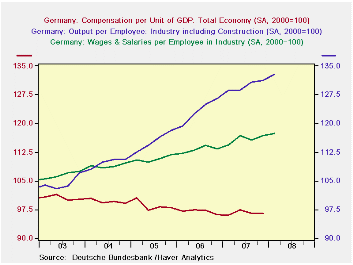
The recent trends in food and oil prices suggest that the future impact of inflation may be less benign.
| GERMANY | Mar 08 | Feb 08 | Mar 07 | M/M Chg | Y/Y Chg | 2007 | 2006 | 2005 |
|---|---|---|---|---|---|---|---|---|
| Hourly Compensation (2005 =100) | 106.0 | 109.4 | 104.0 | -0.04 | 2.3 | 104.8 | 102.3 | 100.0 |
| CPI (2005 =100) | 106.1 | 105.7 | 103.0 | 0.38 | 3.01 | 103.9 | 101.6 | 100.0 |
| Hourly Compensation (2005 =100) | 106.0 | 109.4 | 104.0 | -0.04 | 2.3 | 104.8 | 102.3 | 100.0 |
| Q1 08 | Q4 07 | Q3 07 | Q2 07 | Q1 07 | 2007 | 2006 | 2005 | |
| Productivity(2000=100) | 132.8 | 132.1 | 130.8 | 129.6 | 129.7 | 129.8 | 123.3 | 115.4 |
| Compensation of Labor (2000=100) | 117.4 | 116.7 | 115.7 | 116.8 | 114.5 | 115.9 | 113.2 | 110.7 |
| Unit Labor Cost (2000=100) | -- | 96.6 | 96.6 | 97.4 | 96.0 | 96.7 | 97.0 | 99.5 |

Tom Moeller
AuthorMore in Author Profile »Prior to joining Haver Analytics in 2000, Mr. Moeller worked as the Economist at Chancellor Capital Management from 1985 to 1999. There, he developed comprehensive economic forecasts and interpreted economic data for equity and fixed income portfolio managers. Also at Chancellor, Mr. Moeller worked as an equity analyst and was responsible for researching and rating companies in the economically sensitive automobile and housing industries for investment in Chancellor’s equity portfolio. Prior to joining Chancellor, Mr. Moeller was an Economist at Citibank from 1979 to 1984. He also analyzed pricing behavior in the metals industry for the Council on Wage and Price Stability in Washington, D.C. In 1999, Mr. Moeller received the award for most accurate forecast from the Forecasters' Club of New York. From 1990 to 1992 he was President of the New York Association for Business Economists. Mr. Moeller earned an M.B.A. in Finance from Fordham University, where he graduated in 1987. He holds a Bachelor of Arts in Economics from George Washington University.
More Economy in Brief


