 Global| Nov 06 2008
U.S. Jobless Insurance Claims Remained Elevated
by:Tom Moeller
|in:Economy in Brief
Summary
The job market remains weak.That's the message from the figures covering initial claims for jobless insurance. Last week, they held roughly steady at 481,000 with an upwardly revised reading of 485,000 during the prior week. [...]
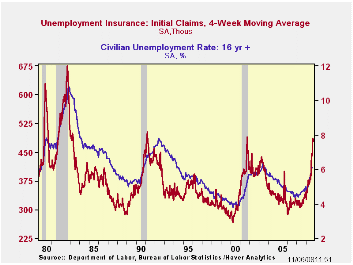
The job market remains weak.That's the message from the figures covering initial claims for jobless insurance. Last week, they held roughly steady at 481,000 with an upwardly revised reading of 485,000 during the prior week. Expectations had been for 476,000 claims. The latest figures were down slightly from the cycle's high, which was boosted after Hurricane Ike, but they were up by half from the year ago level. The four-week moving average of initial claims fell slightly to 477,000 (43.8% y/y).
The largest increases in initial claims for the week ending
October 25 were in Pennsylvania (+5,579), California (+4,617), Illinois
(+4,314), Ohio (+3,949), and North Carolina (+3,179), while the largest
decreases were in Texas (-5,898), Tennessee (-2,078), Kansas (-1,067),
Arkansas (-1,003), and Florida (-661).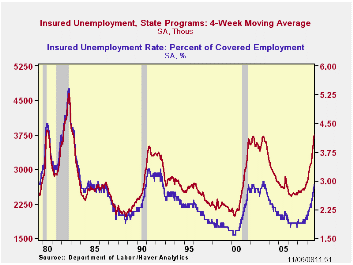
Continuing claims for unemployment insurance during the week of October 25 rose a sharp 122,000 after the prior week's 6,000 decline. The four-week average of continuing claims rose to 3,754,000 it is this cycle's high and the highest (just barely) since 1983. Continuing claims provide some indication of workers' ability to find employment and they lag the initial claims figures by one week.
The insured rate of unemployment was stable for the third week at 2.8%, this cycle's high and the highest since mid-2003. The peak rate in that recessionary period was 3.0% reached in late June 2003. The Commerce Department indicated that the highest insured unemployment rates in the week ending October 18 were in Oregon (3.6 percent), the Virgin Islands (3.6), Michigan (3.5), Nevada (3.5), California (3.4), Puerto Rico (3.4), South Carolina (3.3), Arkansas (3.2), New Jersey (3.2), and Pennsylvania (3.2).
Understanding inflation and the implications for monetary policy: a Phillips curve retrospective from the Federal Reserve Bank of New England is available here.
| Unemployment Insurance (000s) | 11/01/08 | 10/25/08 | 10/18/08 | Y/Y | 2007 | 2006 | 2005 |
|---|---|---|---|---|---|---|---|
| Initial Claims | 481 | 485 | 479 | 48.5% | 322 | 313 | 331 |
| Continuing Claims | -- | 3,843 | 3,721 | 48.4 | 2,552 | 2,459 | 2,662 |
by Tom Moeller November 6, 2008
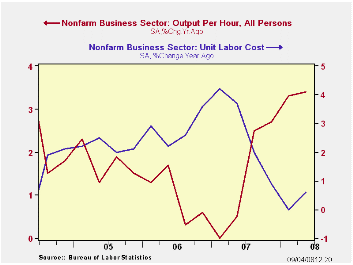
Labor productivity in the nonfarm business sector rose 1.1% last quarter. That gain was down by two-thirds from the 2Q increase and by half from 1Q. Nonetheless, the y/y gain of 2.0% remained nearly the quickest since 2004. The latest increase about matched Consensus expectations for 3Q.
Output growth fell to a negative 1.7% (+0.3% y/y) which was its weakest since the 2001 recession. Productivity, however, still rose as hours worked were reduced by an even greater degree. They declined 2.7% (-1.7% y/y).
Growth in compensation per hour nevertheless accelerated to 4.7% and that raised the y/y growth to 4.3%.
As a result of weaker productivity and quicker compensation,
unit labor cost growth jumped to 3.6%. That was off the recent highs
near 4.0% but the trend is one of acceleration.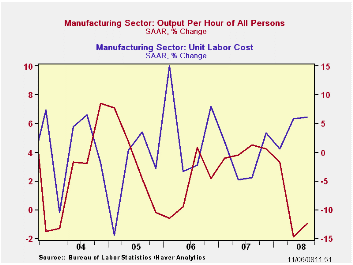
In the factory sector productivity declined at a 1.0% (+1.1% y/y) rate and that was the second consecutive quarterly decline following a 3.4% increase last year. Output declined 2.6% y/y and hours worked were reduced by an even greater 3.7% y/y. Compensation growth quickened to 5.1%, the fastest since 2006. As a result, unit labor cost growth 6.1% last quarter and by 3.9% y/y, the fastest since late-2006.
The Current State of the U.S. Economy and the Fed’s Response (With Reference to Irrational Exuberance and Virgil’s Aeneid) from the Federal Reserve Bank of Dallas is available here.
Multinationals Make the Most of IT from the Federal Reserve Bank of St. Louis is available here.
| Nonfarm Business Sector (SAAR, %) | 3Q '08 | 2Q '08 | Y/Y | 2007 | 2006 | 2005 |
|---|---|---|---|---|---|---|
| Output per Hour | 1.1 | 3.6 | 2.0 | 1.4 | 1.0 | 1.8 |
| Compensation per Hour | 4.7 | 3.5 | 4.3 | 4.1 | 3.8 | 4.0 |
| Unit Labor Costs | 3.6 | -0.1 | 2.3 | 2.7 | 2.8 | 2.2 |
by Robert Brusca November 6, 2008
German officials have officially ended their excursion trip
with optimism. During their journey through fantasy land, they did take
their turns in showing how wrong they can be. From the start of the US
slowing, they thought Europe had decoupled and that the euro could
continue to rise with little ill effect on the Zone. When the other
e-Zone countries were affected they said Germany was different. When
the banking crisis hit the US they said German banks were strong and
did not have these sorts of problems. Recently they had believed
Germany was going to be so much less affected by the growing recession
in Europe as policymakers announced that Germany was better prepared to
meet the crisis. And so it may be. And we shall find out because ready
or not here it comes.
The pop in orders in August may have errantly encouraged the
belief that Germany was wearing some sort of special recession-proof
vest. But now Super-Germany has met its Kryptonite. The Sept plunge in
orders of -8% is the largest drop since German unification and has
swept optimism aside. Germany is now, after all, just another European
country with an economy under pressure, not a special case
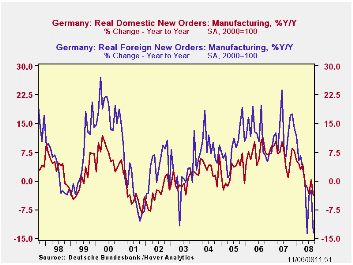
Moreover a perusal of the trends makes is crystal clear that
this downturn has been building for some time. Optimism in retrospect
looks a bit like whistling past the graveyard. August’s orders gain was
a rogue rise of 3.5% sandwiched in between drops of 1.7% in July and
now 8% in September. The sequential growth rates get progressively more
negative from -9% over 12 months to -12% over six months to -23% over
three months. Similarly the foreign and domestic orders show the same
progressions.
Germany is getting pulled down more by weakness from the
outside. So, in some sense, it is true that Germany has been faring
better. But in good times German export orders boomed beyond the reach
of domestic orders as well. Germany is simply a lower growth more
stable economy than the world in which it trades. Yet weakness abroad
will weigh on Germany just as a global boom will boost it. Because
Germany is plugged into that trading system, it shares the good and bad
times with the world it exports to. There is nothing unusual about that
or about the effect of that on Germany in this cycle.
The German industrial sales figures underline the issues.
German sales are showing the same sort of progressive declines. For a
while Germany was growing better than its trading partners because it
deals a lot in capital goods. One year ago German capital goods growth
rates rose 8% Yr/Yr while overall German sales rose by just 5.8%. But
in September German capital goods orders are being crushed. They are
falling by 5.2% in Sept alone. Their three-month pace of contraction is
-14.4% rivaling the 15.5% drop in the usually volatile sales of
consumer durable goods.
Germany has been caught in the same web of weakness that all
of Europe is in. Today’s industrial orders report combines with the
week’s earlier reports from the MFG and Services sector purchasers data
from Markit to show that weakness is spreading in Germany as well as
across the e-Zone.
Germany is in the soup along with the rest of Europe although
it may be submerging at a slightly slower rate. There can be little
doubt that Germany, like the rest of Europe is submerging. Down
periscope.
| German Orders and Sales By Sector and Origin | ||||||||
|---|---|---|---|---|---|---|---|---|
| Real and SA | % M/M | % Saar | ||||||
| Sep-08 | Aug-08 | Jul-08 | 3-Mo | 6-Mo | 12-Mo | Yr Ago | QTR-2-Date | |
| Total Orders | -8.0% | 3.5% | -1.7% | -23.0% | -12.2% | -9.0% | 6.4% | -14.7% |
| Foreign | -11.4% | 4.3% | -1.2% | -30.7% | -16.7% | -13.6% | 12.1% | -17.8% |
| Domestic | -4.3% | 2.8% | -2.1% | -14.2% | -7.4% | -3.9% | 0.8% | -11.4% |
| Real Sector Sales | ||||||||
| MFG/Mining | -4.0% | 4.5% | -2.4% | -8.2% | -4.2% | -1.9% | 5.8% | -5.0% |
| Consumer | -0.6% | 2.0% | -0.4% | 4.0% | 2.0% | -2.6% | 1.3% | -0.9% |
| Consumer Durables | -6.3% | 6.8% | -4.2% | -15.5% | -8.1% | -5.8% | 2.4% | -7.7% |
| Consumer Non-Durable | 0.6% | 1.2% | 0.3% | 8.5% | 4.2% | -1.9% | 1.0% | 0.6% |
| Capital Goods | -5.2% | 5.7% | -4.0% | -14.4% | -7.5% | -1.2% | 8.0% | -9.2% |
| Intermediate Goods | -4.3% | 4.2% | -1.7% | -7.5% | -3.8% | -2.6% | 6.0% | -2.5% |
| All MFG-Sales | -3.9% | 4.4% | -2.2% | -7.4% | -3.8% | -1.9% | 5.3% | -4.5% |

Tom Moeller
AuthorMore in Author Profile »Prior to joining Haver Analytics in 2000, Mr. Moeller worked as the Economist at Chancellor Capital Management from 1985 to 1999. There, he developed comprehensive economic forecasts and interpreted economic data for equity and fixed income portfolio managers. Also at Chancellor, Mr. Moeller worked as an equity analyst and was responsible for researching and rating companies in the economically sensitive automobile and housing industries for investment in Chancellor’s equity portfolio. Prior to joining Chancellor, Mr. Moeller was an Economist at Citibank from 1979 to 1984. He also analyzed pricing behavior in the metals industry for the Council on Wage and Price Stability in Washington, D.C. In 1999, Mr. Moeller received the award for most accurate forecast from the Forecasters' Club of New York. From 1990 to 1992 he was President of the New York Association for Business Economists. Mr. Moeller earned an M.B.A. in Finance from Fordham University, where he graduated in 1987. He holds a Bachelor of Arts in Economics from George Washington University.
More Economy in Brief


