 Global| Dec 27 2018
U.S. Jobless Claims Remain Extremely Low
Summary
Initial unemployment insurance claims edged down to 216,000 (-10.7% y/y) during the week ended December 22, from an upwardly revised 217,000 during the previous week. The last time initial claims were in this range was 1973. The [...]
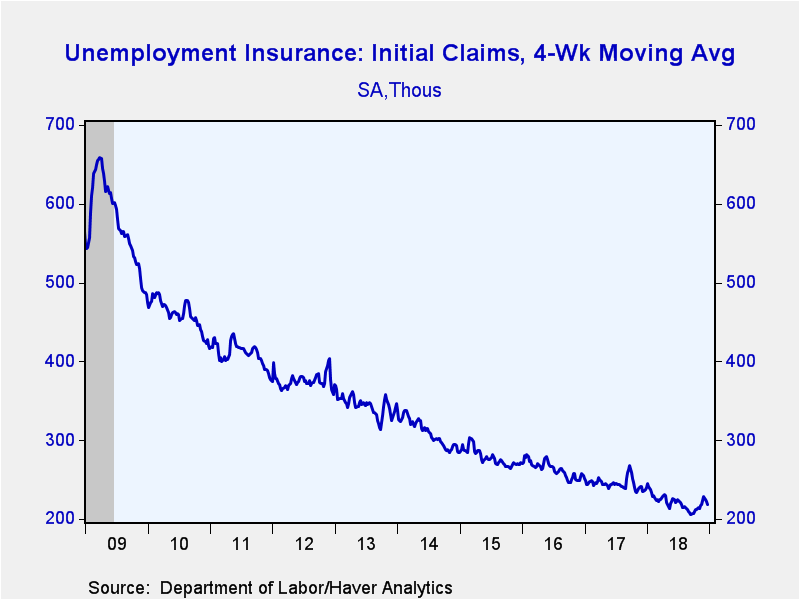
Initial unemployment insurance claims edged down to 216,000 (-10.7% y/y) during the week ended December 22, from an upwardly revised 217,000 during the previous week. The last time initial claims were in this range was 1973. The Action Economics Forecast Survey expectation was for 216,000 new filings. The four-week moving average declined to 218,000.
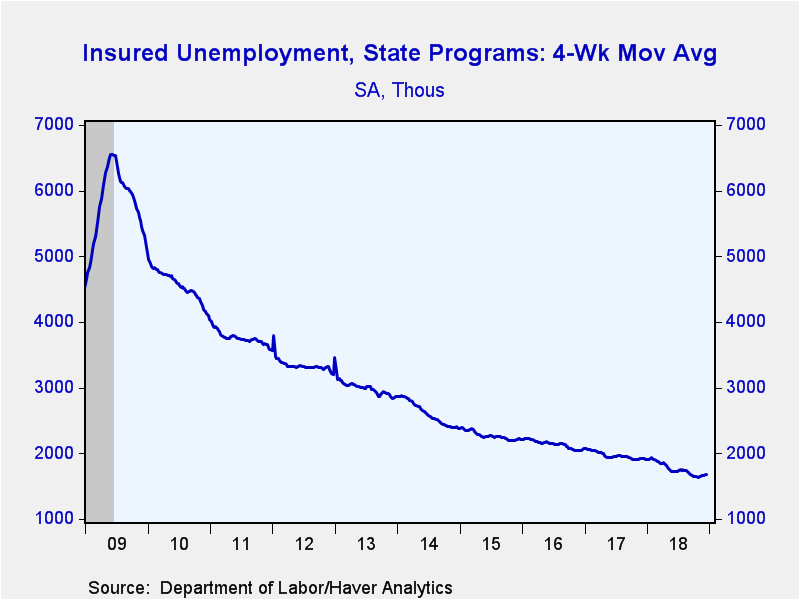
Continuing claims for unemployment insurance slipped to 1.701 million (-12.1% y/y) in the week of December 15, from 1.705 million the week earlier. The four-week moving average of continuing claims was nearly unchanged at 1.676 million.
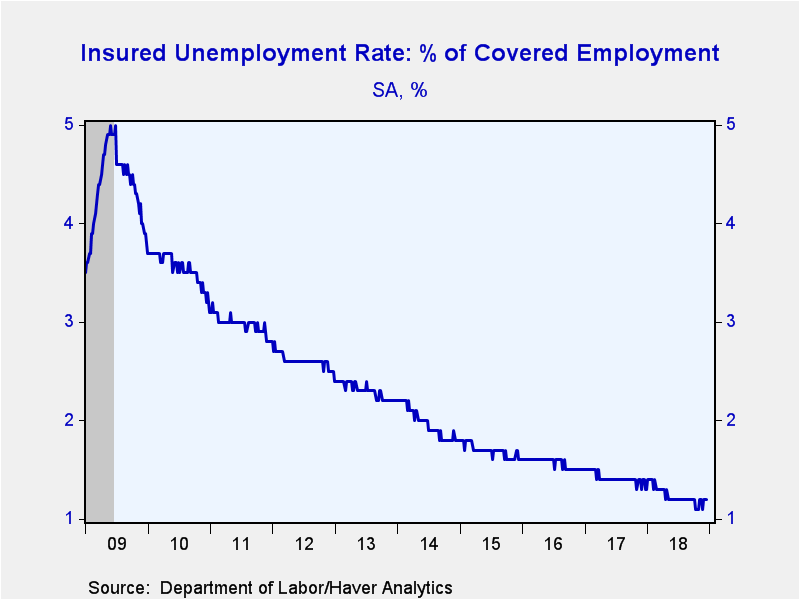
The insured unemployment rate, which compares the number of people receiving benefits to the number of people covered by unemployment insurance, held steady at 1.2%, near the record low.
Layoff activity has been extremely low during this expansion. As a point of reference, the last time initial claims were at current levels (in 1973), the insured unemployment rate was 2.6%, reflecting the fact that the labor force was roughly half its current size.
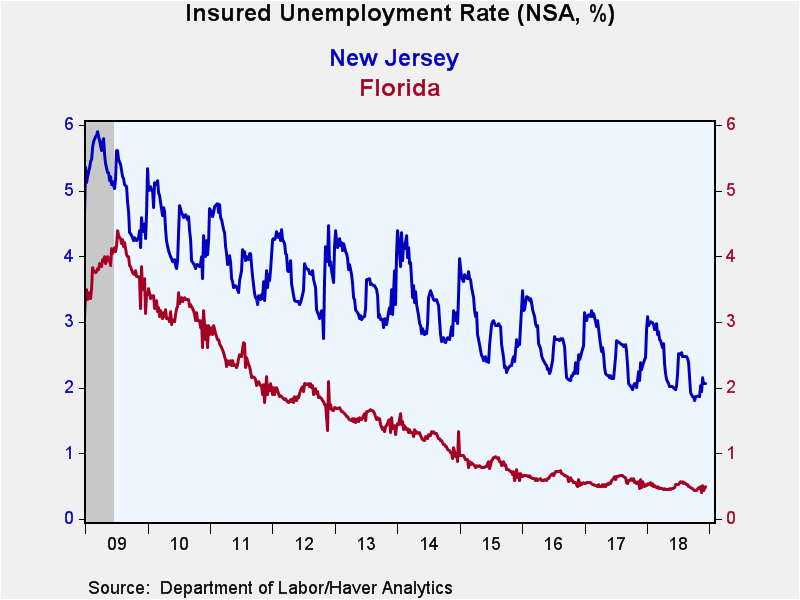
Insured unemployment rates vary widely by state. Currently, Northeast and West Coast states generally have high unemployment rates, while Southern states have low rates. During the week ending December 8, the lowest rates were in North Carolina (0.47%), Florida (0.49%), South Dakota (0.51%), Indiana (0.51%), and Tennessee (0.52%). The highest rates were in Pennsylvania (1.91%), Montana (1.92%), California (1.94%), New Jersey (2.07%), and Alaska (3.24%). Among the other largest states by population, the insured unemployment rate was 0.56% in Georgia, 0.53% in Virginia, 0.96% in Texas, 1.02% in Ohio, 1.40% in Michigan, and 1.43% in New York. These state data are not seasonally adjusted.
Data on weekly unemployment claims going back to 1967 are contained in Haver's WEEKLY database, and they are summarized monthly in USECON. Data for individual states are in REGIONW. The expectations figure is from the Action Economics Forecast Survey, carried in the AS1REPNA database.
| Unemployment Insurance (SA, 000s) | 12/22/18 | 12/15/18 | 12/08/18 | Y/Y % | 2017 | 2016 | 2015 |
|---|---|---|---|---|---|---|---|
| Initial Claims | 216 | 217 | 206 | -10.7 | 245 | 263 | 278 |
| Continuing Claims | -- | 1,701 | 1,705 | -12.1 | 1,961 | 2,136 | 2,267 |
| Insured Unemployment Rate (%) | -- | 1.2 | 1.2 |
1.3 |
1.4 | 1.6 | 1.7 |
Peter D'Antonio
AuthorMore in Author Profile »Peter started working for Haver Analytics in 2016. He worked for nearly 30 years as an Economist on Wall Street, most recently as the Head of US Economic Forecasting at Citigroup, where he advised the trading and sales businesses in the Capital Markets. He built an extensive Excel system, which he used to forecast all major high-frequency statistics and a longer-term macroeconomic outlook. Peter also advised key clients, including hedge funds, pension funds, asset managers, Fortune 500 corporations, governments, and central banks, on US economic developments and markets. He wrote over 1,000 articles for Citigroup publications. In recent years, Peter shifted his career focus to teaching. He teaches Economics and Business at the Molloy College School of Business in Rockville Centre, NY. He developed Molloy’s Economics Major and Minor and created many of the courses. Peter has written numerous peer-reviewed journal articles that focus on the accuracy and interpretation of economic data. He has also taught at the NYU Stern School of Business. Peter was awarded the New York Forecasters Club Forecast Prize for most accurate economic forecast in 2007, 2018, and 2020. Peter D’Antonio earned his BA in Economics from Princeton University and his MA and PhD from the University of Pennsylvania, where he specialized in Macroeconomics and Finance.
More Economy in Brief
 Global| Feb 05 2026
Charts of the Week: Balanced Policy, Resilient Data and AI Narratives
by:Andrew Cates


