 Global| May 07 2010
U.S. Job Market Emits Mixed Signals; Payrolls & Jobless Rate Firm
by:Tom Moeller
|in:Economy in Brief
Summary
Several factors made the latest job report, from the Bureau of Labor Statistics, an interesting read. The best news was an improvement in the rate of hiring. But that wasn't as encouraging as at first glance because it was accompanied [...]
Several factors made the latest job report, from the Bureau of Labor Statistics, an interesting read. The best news was an improvement in the rate of hiring. But that wasn't as encouraging as at first glance because it was accompanied by a rise in the jobless rate. The rate increase, however, wasn't too troubling because it didn't reflect job cuts. The bottom line is that earlier weakness in the labor market is on the mend.
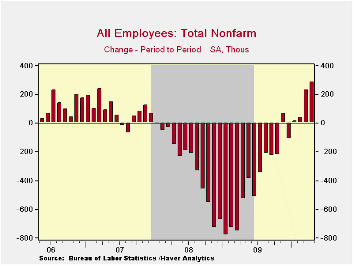
Let's begin with the figures from the establishment survey which indicate a firm 290,000 rise in nonfarm payrolls. The gain followed an upwardly revised 230,000 March increase. These increases were inflated by a 66,000 increase in Census workers which followed a 48,000 March rise. Cutting out government hiring altogether left private sector jobs up 231,000 (-1.2% y/y), the strongest of the five increases in the last six months.
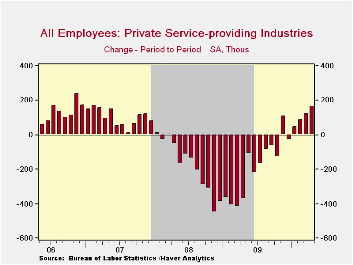
The payroll gain reflected a 116,000 increase in
private-services. It also was the best of five gains during the last
six months. Since December, jobs have risen 0.5%. Temporary jobs, which
have sometimes been a leading job market indicator, rose 26,200 (13.8%
y/y) for the seventh consecutive monthly increase. Professional
& business services jobs rose 80,000 (0.1% y/y), leisure
& hospitality employment increased 45,000 (0.1% y/y) and
education & health services jobs rose 35,000 (2.0% y/y).
Factory sector employment followed the service sector with a 44,000
 increase which was the fourth consecutive
monthly increase. Gains have
been notable in the metals & machinery industries. Amongst
construction businesses, employment rose 14,000 but it was just the
second monthly gain of the economic recovery.
increase which was the fourth consecutive
monthly increase. Gains have
been notable in the metals & machinery industries. Amongst
construction businesses, employment rose 14,000 but it was just the
second monthly gain of the economic recovery.
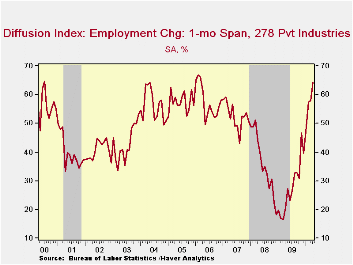
Most impressive was the rise in the breadth of hiring last month. Sixty-four percent of 278 private industries increased hiring. That's improved from the recession low when just 17% were increasing payrolls. During the last three months 61% increased hiring. As impressive was that a like 66% of manufacturing industries raised hiring versus 5% at the low.
Not only are there more individuals being hired, they are working longer. The total workweek of 34.1 hours was up from a low of 33.7 last autumn and was the longest in over a year. The factory sector workweek showed an even greater expansion to its longest since early in the recession.
Workers' pay is starting to improve as well. Last month's 0.3% increase in average hourly earnings followed two months of having been unchanged. Nevertheless the y/y gain of 2.3% remains close to its weakest since early-2004.
Let's look at the unemployment rate's increase. The rise to 9.9% reversed three months of stability when the rate was at its lowest since the recession's end. But here's where the figure gets most interesting. The increase was the product of a 550,000 rise (-1.0% y/y) in employment which roughly matched the strongest since before the recession began. That gain was accompanied by a 805,000 jump (-0.0% y/y) in the labor force which was the strongest since the recession's end.
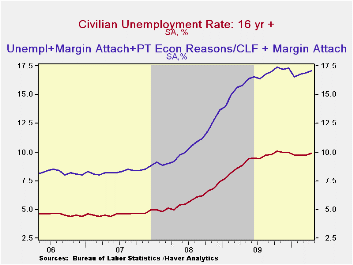
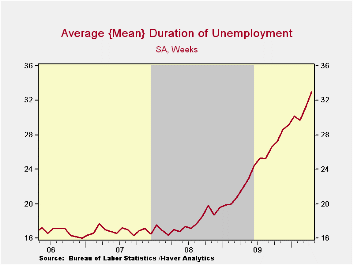
The unemployment rate hides, however, some added strains on the labor market. First, the average duration of unemployment rose to a record 33.0 weeks, roughly twice the level when the recession began. Of those unemployed, 45.9% have been so for six months or longer. If those who are unemployed are added to those individuals who either are marginally attached or who are part-time for economic reasons, the rate rose last month to 17.1%, just under the recession high.
The figures referenced above are available in Haver's USECON database. Additional detail can be found in the LABOR and in the EMPL databases.
What is behind the rise in long-term unemployment? from the Federal Reserve Bank of Chicago is available here.
| Employment: 000s | April | March | February | Y/Y | 2009 | 2008 | 2007 |
|---|---|---|---|---|---|---|---|
| Payroll Employment | 290 | 230 | 39 | -1.0% | -4.3% | -0.6% | 1.1% |
| Previous | -- | 162 | -14 | -- | -- | -- | -- |
| Manufacturing | 44 | 19 | 16 | -3.5% | -11.3% | -3.4% | -2.0% |
| Construction | 14 | 26 | -51 | -9.0% | -15.7% | -6.1% | -0.8% |
| Private Service Producing | 166 | 119 | 90 | -0.3% | -3.4% | -0.2% | 1.7% |
| Government | 59 | 56 | -23 | -0.5% | 0.2% | 1.3% | 1.1% |
| Average Weekly Hours | 34.1 | 34.0 | 33.9 | 33.9(April '09) | 33.1 | 33.6 | 33.8 |
| Average Hourly Earnings | 0.3% | -0.1% | 0.1% | 2.3% | 3.0% | 3.8% | 4.0% |
| Unemployment Rate | 9.9% | 9.7% | 9.7% | 8.6%(April '09) | 9.3% | 5.8% | 4.6% |

Tom Moeller
AuthorMore in Author Profile »Prior to joining Haver Analytics in 2000, Mr. Moeller worked as the Economist at Chancellor Capital Management from 1985 to 1999. There, he developed comprehensive economic forecasts and interpreted economic data for equity and fixed income portfolio managers. Also at Chancellor, Mr. Moeller worked as an equity analyst and was responsible for researching and rating companies in the economically sensitive automobile and housing industries for investment in Chancellor’s equity portfolio. Prior to joining Chancellor, Mr. Moeller was an Economist at Citibank from 1979 to 1984. He also analyzed pricing behavior in the metals industry for the Council on Wage and Price Stability in Washington, D.C. In 1999, Mr. Moeller received the award for most accurate forecast from the Forecasters' Club of New York. From 1990 to 1992 he was President of the New York Association for Business Economists. Mr. Moeller earned an M.B.A. in Finance from Fordham University, where he graduated in 1987. He holds a Bachelor of Arts in Economics from George Washington University.
More Economy in Brief


