 Global| Jul 06 2009
U.S. ISM Nonmanufacturing IndexImproves To The Highest Level Since Last September
by:Tom Moeller
|in:Economy in Brief
Summary
The service sector continued to show signs of improvement during June. The Composite Index for the nonmanufacturing sector from the Institute for Supply Management (ISM) rose to 47.0 from an unrevised reading of 44.0 during May. [...]
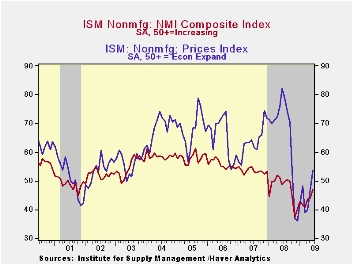
The service sector continued to show signs of improvement during June. The Composite Index for the nonmanufacturing sector from the Institute for Supply Management (ISM) rose to 47.0 from an unrevised reading of 44.0 during May. Though still below the break-even level of 50, the latest was the highest level since September of last year and it beat Consensus expectations for a reading of 46.0. A level of the ISM index below 50 indicates declining activity. Since the series' inception in 1997 there has been a 60% correlation between the level of the business activity index in the nonmanufacturing sector and the Q/Q change in real GDP for the services and the construction sectors.
That latest rise came as the employment index jumped to its
highest level (43.4) since September. Since the series' inception in
1997 there has been a 56% correlation between the level of the ISM
nonmanufacturing employment index and the m/m change in payroll
employment in the service-producing plus the construction industries.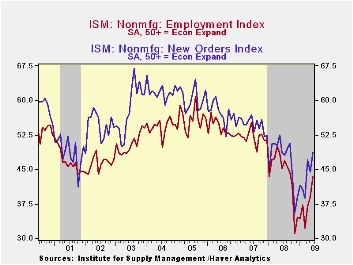
The overall business activity index for the service sector rose to 49.8 which was its highest level since September. Also rising to a nine-month high was the new orders series. The gain to 48.6 pulled it well above from last November's low of 35.6. Continuing to suggest that some slack remains in the service sector was a decline in the supplier deliveries component which fell back to near the series' lowest level.
With an upside breakout, the price index rose about as it did during May. The strong 6.8 point gain to 53.7 was also the highest level since last September. Since its inception ten years ago, there has been a 60% correlation between the price index and the q/q change in the GDP services chain price index.
Beginning with the January 2008 Nonmanufacturing Report On Business®, the composite index is calculated as an indicator of the overall economic condition for the non-manufacturing sector. It is a composite index based on the diffusion indices of four of the indicators (business activity, new orders, employment and supplier deliveries) with equal weights. The latest report from the ISM can be found here.
ISM surveys more than 370 purchasing managers in more than 62 industries including law firms, hospitals, government and retailers. The nonmanufacturing survey dates back to July 1997.
Lessons Learned from the Financial Crisis from the Federal Reserve Bank of New York can be found here.
| ISM Nonmanufacturing Survey | June | May | June '08 | 2008 | 2007 | 2006 |
|---|---|---|---|---|---|---|
| Composite Index | 47.0 | 43.7 | 48.8 | 47.4 | 53.5 | 55.7 |
| Business Activity | 49.8 | 42.4 | 50.7 | 47.4 | 56.0 | 58.0 |
| Employment | 43.4 | 39.0 | 45.2 | 43.8 | 52.0 | 53.8 |
| Prices Index | 53.7 | 46.9 | 82.1 | 66.0 | 63.8 | 65.3 |
by Tom Moeller July 6, 2009
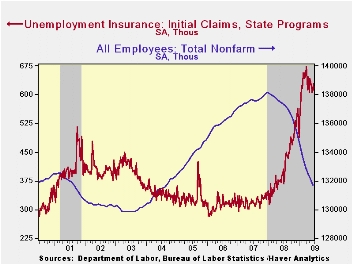
Despite the week-to-week gyration, initial claims for unemployment insurance have moved sideways since April, trending slightly downward. Reported Thursday, claims edged down last week by 16,000 to 614,000 after an upwardly revised 18,000 increase during the week prior. The latest level was off from the March peak of 674,000. The four-week average of claims, which smoothes out some of the volatility in the weekly numbers, also fell slightly to 615,250 which was its lowest level since mid-February. The latest weekly level roughly matched Consensus expectations.
The Labor Department indicated that the largest increases in
initial claims for the week ending June 20 were in California
(+14,570), New Jersey (+3,170), Oregon (+3,062), Maryland (+2,342), and
Michigan (+2,032), while the largest decreases were in Missouri
(-5,753), Pennsylvania (-3,037), Texas (-2,759), Alabama (-1,926), and
Florida (-1,894).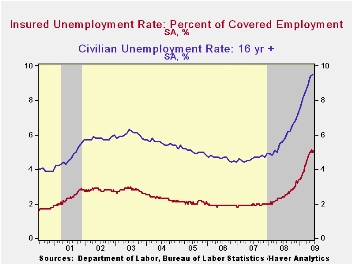
Also suggesting improvement in the job market was a 53,000 decline in continuing claims for unemployment insurance which reversed all of the prior week's gain. Weekly claims were down slightly from their May high. Continuing claims provide an indication of workers' ability to find employment. At 6,702,000, however, claims remained more than twice the year ago level. The four-week average of continuing claims again fell just slightly from their record high. The series dates back to 1966.
These improvements in the weekly claims figures have led to a leveling out of the insured unemployment rate. It slipped to 5.0% where it has been for the last seven weeks. Nevertheless, job market distress is evidenced by the fact that the level remained more than double that of June 2008 and the highest since 1983. During the last ten years there has been a 93% correlation between the level of the insured unemployment rate and the overall rate of unemployment published by the Bureau of Labor Statistics.
The highest insured unemployment rates in the week ending June 13 were in Michigan (7.5 percent), Oregon (6.7), Puerto Rico (6.6), Nevada (6.3), Pennsylvania (6.2), Wisconsin (5.7), California (5.4), South Carolina (5.3), Arkansas (5.2), Illinois (5.2), and North Carolina (5.2).
The unemployment insurance claims data is available in Haver's WEEKLY database and the state data is in the REGIONW database.
Reply to Generalizing the Taylor Principle: A Comment from the Federal Reserve Bank of Kansas City can be found here.
| Unemployment Insurance (000s) | 06/27/09 | 06/20/09 | 06/13/09 | Y/Y | 2008 | 2007 | 2006 |
|---|---|---|---|---|---|---|---|
| Initial Claims | 614 | 630 | 612 | 51.6% | 420 | 321 | 313 |
| Continuing Claims | -- | 6,702 | 6,755 | 112.6% | 3,342 | 2,552 | 2,459 |
by Robert Brusca July 6, 2009
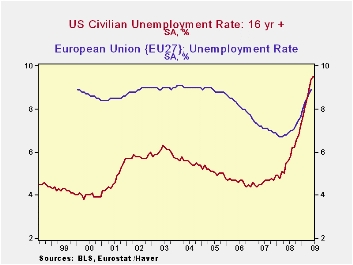
The accompanying chart makes the point that US rate of
unemployment has risen a lot and Europe’s has risen by a little. Still
the higher US rate of unemployment will fall sharply in recovery
whereas Europe’s history suggests that its rate will remain above the
rate of unemployment in America even when it falls. Europe’s labor
markets are more insulated and less flexible. That will be the next
challenge for Europe.
In Europe a few statistics show us how disparate conditions
can be even within the EMU portion of Europe. German unemployment is up
by just 0.3% points over the last 12 months. French unemployment is up
by 1.7 percentage points. Spain’s unemployment is up by 8.2 percentage
points, accounting for the bulk of the rise of the rate of unemployment
in EMU over the past year. Over the same period the US rate is up by
3.9 percentage points, and Japan’s rate is up by 1.2 percentage points.
While there are regional disparities in most large countries,
especially in the US and in Japan. But because of its single monetary
structure and split fiscal structure, regional disparities of the sort
EMU is bearing put a great deal more pressure on the system than would
be the case in a true single independent nation.
For the US, a period like this offer the economy the
opportunity to reinvent itself as old businesses are killed off and new
opportunities and needs reveal themselves. Of course, in this cycle
some old US industries were bailed out because the government thought
they were still worthwhile. Europe has had same the same experience.
Both Europe and the US will be leaving this episode of
recession with much higher levels of debt. This will be a challenge for
the period ahead. The US has showed an ability to get strong growth and
rebuild tax revenues in recoveries. Europe has not showed that same
sort of dynamism. Certain European countries, EMU members (plus the UK)
have the added burden of Maastricht criterion that quantitatively
restricts their debt levels relative to GDP. As recovery sets in, most
EMU nations will be in violation of this rule and it is not clear how
much time the authorities will allow for the rule to be put back in
force. An early imposition of the rule will lead to fiscal contraction
and could hamper recovery.
That will be an extra problems facing Europe once we turn the
corner into recovery.
| Unemployment rate and changes | ||||||
|---|---|---|---|---|---|---|
| Level | Simple Changes | |||||
| May-09 | Apr-09 | Mar-09 | 3-Mo | 6-Mo | 12-Mo | |
| EU-Urate | 8.9 | 8.7 | 8.5 | 0.6 | 1.4 | 2.1 |
| EMU-Urate | 9.5 | 9.3 | 9.0 | 0.7 | 1.5 | 2.1 |
| m/m% | % changes (ar) | |||||
| EU-U 000s | 1.8% | 2.6% | 3.2% | 7.8% | 19.8% | 31.3% |
| EMU-U 000s | 1.9% | 2.8% | 3.0% | 7.9% | 18.6% | 29.3% |
| U-Rates | Level | Simple Changes | ||||
| Germany | 7.7 | 7.7 | 7.5 | 0.3 | 0.6 | 0.3 |
| France | 9.3 | 9.1 | 9 | 0.5 | 1.1 | 1.7 |
| Spain | 18.7 | 18 | 17.3 | 2.2 | 4.7 | 8.2 |
| USA | 9.4 | 8.9 | 8.5 | 1.3 | 2.6 | 3.9 |
| Japan | 5.2 | 5 | 4.8 | 0.8 | 1.2 | 1.2 |
by Robert Brusca July 6, 2009
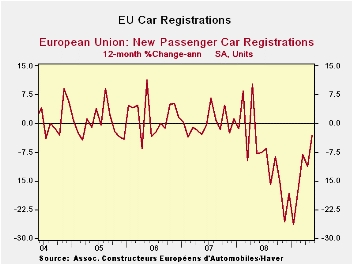
Special programs to incentivize new car purchases are having
success in spurring new passenger car registrations in Europe. European
Commission President Jose Manuel Barroso said Monday that the recession
in Europe will extend throughout 2009. Yet the auto sector is doing
much better now.
These key large European economies show momentum building from
12-months to six months to three-months. Although most of retails sales
is languishing, the special incentives have prompted auto sales to
revive. In Germany the strongest growth is over six months as the three
month growth rate has backed off. France exhibits the same sort of
pattern but with much less strength over six months and three months.
Sales in Spain over three-months are exploding despite the
ongoing crash in the housing market there. Sales in the UK have finally
showing some growth over three-months buts sales there are still lower
on six months and 12-months.
Auto sales alone will not be enough to turn around the sagging
European economy. Much of Europe depends on export sales reviving; that
will require a more balanced rebound and for recovery to spread to the
surrounding area in Eastern Europe as well. For now, sales inventive
plans seem to be working for autos and that will help to spread some
optimism and growth and should combine with other programs to help to
get growth back on track in 2010.
| E Area Car Registrations | |||||||||
|---|---|---|---|---|---|---|---|---|---|
| 3-Mo
Trend From |
6-Mo
Trend From |
12-Mo
Trend From |
|||||||
| All
Seasons
Adjusted |
Jun-09 | May-09 | Apr-09 | Jun-09 | May-09 | Jun-09 | May-09 | Jun-09 | May-09 |
| Germany: | 6.5% | -6.2% | 15.8% | 79.1% | 2.2% | 128.3% | 125.9% | 40.7% | 39.4% |
| France (&WDA) | -10.6% | 17.7% | -2.4% | 11.2% | 123.3% | 19.3% | 48.9% | 6.6% | 14.6% |
| Italy | 20.3% | -12.3% | 9.7% | 79.9% | 34.3% | 12.8% | 20.8% | 11.5% | -9.4% |
| Spain | 25.9% | -9.3% | 15.9% | 206.5% | -12.4% | 22.1% | -9.3% | -16.0% | -39.1% |
| UK | 9.6% | -6.6% | 10.2% | 62.5% | -20.2% | -9.8% | 17.5% | -16.7% | -25.5% |
| Base Month of Calculation | May-09 | Apr-09 | Mar-09 | Mar-09 | Feb-09 | Dec-08 | Nov-08 | Jun-08 | May-08 |
by Louise Curely 6, 2009
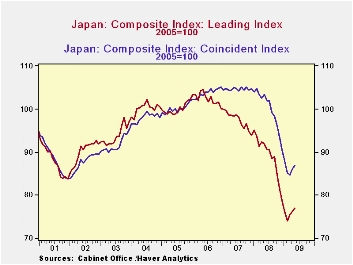 Japan's
Composite Leading and Coincident Indexes of Business Conditions
continued to improve in May, as shown in the first chart.
Japan's
Composite Leading and Coincident Indexes of Business Conditions
continued to improve in May, as shown in the first chart.
The
leading indicator index was 77.0 (2005=100) in May, after having
increased 0.6%, 0.6% and 0.8% in May, April and March,
respectively. 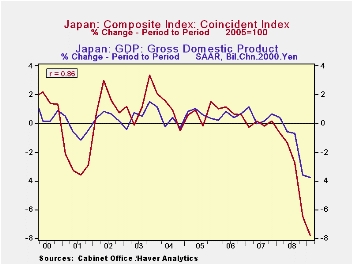 The coincident indicator at 86.9 in May was
1.1% higher than April, which, in turn, was 1.4% above March.
These improvements suggest that economic conditions in the second
quarter should be considerably better than those in the first quarter,
when GDP declined at an annual rate of 14.2%. Since 2000
there has been a correlation of .86 between the period to period
changes in the quarterly composite coincident indicator and real GDP,
as can be seen in the second chart.
The coincident indicator at 86.9 in May was
1.1% higher than April, which, in turn, was 1.4% above March.
These improvements suggest that economic conditions in the second
quarter should be considerably better than those in the first quarter,
when GDP declined at an annual rate of 14.2%. Since 2000
there has been a correlation of .86 between the period to period
changes in the quarterly composite coincident indicator and real GDP,
as can be seen in the second chart.
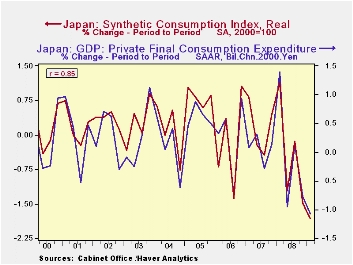 Another
forward looking
indicator is the Synthetic Consumption Index. This index,
which combines demand side statistics (Family Income and Expenditure
Surveys, etc.) and supply side statistics (Indexes of
Industrial Producers' Shipments, etc.), has risen in the last three
months and now stands at 104.91 (2000=100). Since 2000, there
has been a correlation of .85 between the period to period percent
change in the quarterly Synthetic Consumption Index and in the Private
Consumption component of GDP, as shown in the third chart.
Another
forward looking
indicator is the Synthetic Consumption Index. This index,
which combines demand side statistics (Family Income and Expenditure
Surveys, etc.) and supply side statistics (Indexes of
Industrial Producers' Shipments, etc.), has risen in the last three
months and now stands at 104.91 (2000=100). Since 2000, there
has been a correlation of .85 between the period to period percent
change in the quarterly Synthetic Consumption Index and in the Private
Consumption component of GDP, as shown in the third chart.
| JAPAN | May 09 | Apr 09 | Mar 09 | Feb 09 | Jan 09 | Ave Apr/May | Q1 09 |
|---|---|---|---|---|---|---|---|
| Composite Indicators of Business Conditions (2005=100) | |||||||
| Leading Indicators | 77.0 | 76.2 | 75.5 | 74.1 | 76.2 | 77.6 | 75.3 |
| Coincident Indicators | 86.9 | 86.0 | 84.8 | 85.2 | 88.0 | 86.5 | 86.0 |
| Synthetic Consumption Indicator (Real 2000=100) | 104.91 | 104.31 | 103.71 | 102.88 | 104.33 | 104.61 | 103.64 |

Tom Moeller
AuthorMore in Author Profile »Prior to joining Haver Analytics in 2000, Mr. Moeller worked as the Economist at Chancellor Capital Management from 1985 to 1999. There, he developed comprehensive economic forecasts and interpreted economic data for equity and fixed income portfolio managers. Also at Chancellor, Mr. Moeller worked as an equity analyst and was responsible for researching and rating companies in the economically sensitive automobile and housing industries for investment in Chancellor’s equity portfolio. Prior to joining Chancellor, Mr. Moeller was an Economist at Citibank from 1979 to 1984. He also analyzed pricing behavior in the metals industry for the Council on Wage and Price Stability in Washington, D.C. In 1999, Mr. Moeller received the award for most accurate forecast from the Forecasters' Club of New York. From 1990 to 1992 he was President of the New York Association for Business Economists. Mr. Moeller earned an M.B.A. in Finance from Fordham University, where he graduated in 1987. He holds a Bachelor of Arts in Economics from George Washington University.
More Economy in Brief


