 Global| Jun 03 2009
U.S. ISM Nonmanufacturing Index Improves Further
by:Tom Moeller
|in:Economy in Brief
Summary
Improvement in service sector activity is accompanying the factory sector's recent rise. The May Composite Index for the nonmanufacturing sector from the Institute for Supply Management (ISM) rose to 44.0 last month from an unrevised [...]
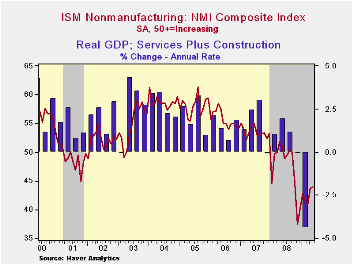
Improvement in service sector activity is accompanying the factory sector's recent rise. The May Composite Index for the nonmanufacturing sector from the Institute for Supply Management (ISM) rose to 44.0 last month from an unrevised reading of 43.7 during April. The latest was the highest level since October of last year but it was slightly lower than Consensus expectations for a May reading of 45.0. A level of the ISM index below 50 indicates declining activity. Since the series' inception in 1997 there has been a 60% correlation between the level of the business activity index in the nonmanufacturing sector and the Q/Q change in real GDP for the services and the construction sectors.
That latest rise came as the employment index rose to its
highest level since October. Since the series' inception in 1997 there
has been a 56% correlation between the level of the ISM
nonmanufacturing employment index and the m/m change in payroll
employment in the service-producing plus the construction
industries.Also to the upside was the supplier deliveries index. 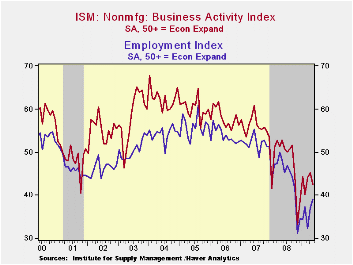
Countering these gains were declines in the business activity sub-index after two months of improvement. The new orders series also fell but just slightly. At 44.4 it remained well up from last November's low of 35.6.
Pricing power has shown moderate improvement this year in that earlier declines have not continued. The price index has been relatively stable in a range of 36 to 48 after reaching a high of 82.1 last Spring. Since its inception ten years ago, there has been a 60% correlation between the price index and the q/q change in the GDP services chain price index.
Beginning with the January 2008 Nonmanufacturing Report On Business®, the composite index is calculated as an indicator of the overall economic condition for the non-manufacturing sector. It is a composite index based on the diffusion indices for four of the indicators (business activity, new orders, employment and supplier deliveries) with equal weights. The latest report from the ISM can be found here.
ISM surveys more than 370 purchasing managers in more than 62 industries including law firms, hospitals, government and retailers. The nonmanufacturing survey dates back to July 1997.
| ISM Nonmanufacturing Survey | May | April | May '08 | 2008 | 2007 | 2006 |
|---|---|---|---|---|---|---|
| Composite Index | 44.0 | 43.7 | 51.2 | 47.4 | 53.5 | 55.7 |
| Business Activity | 42.4 | 45.2 | 52.9 | 47.4 | 56.0 | 58.0 |
| Employment | 39.0 | 37.0 | 48.3 | 43.8 | 52.0 | 53.8 |
| Prices Index | 46.9 | 40.0 | 75.6 | 66.0 | 63.8 | 65.3 |
by Tom Moeller June 3, 2009
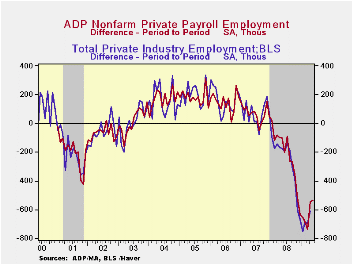
No doubt the job market has yet to materially improve. However, the latest report from the payroll processor ADP in their National Employment Report showed an easing in the rate of contraction. It indicated that private nonfarm payrolls fell 532,000 last month after a revised 545,000 decline during April. (Recent months' declines were revised deeper from the earlier estimates.) The latest reading was the sixteenth consecutive monthly decline, but the annualized rate of decline in payrolls eased somewhat to 6.3% during the last three months.
ADP compiled the estimate from its database of individual companies' payroll information. Macroeconomic Advisers, LLC, the St. Louis economic consulting firm, developed the methodology for transforming the raw data into an economic indicator.
The U.S. Bureau of Labor Statistics will report payroll employment this Friday. For comparison, April's 545,000 worker decline in ADP's measure of private nonfarm payrolls was accompanied by 611,000 job losses in the BLS measure of private sector payrolls. According to ADP and Macro-Advisers, the correlation between the monthly percentage change in the ADP estimate and that in the BLS data is 0.90.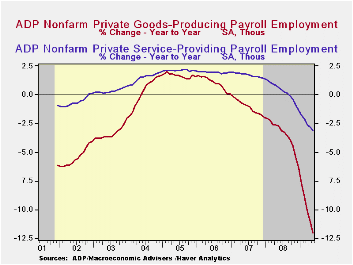
ADP reported that last month medium-sized payrolls fell 223,000 (-5.3% y/y) followed by a 209,000 (-4.0% y/y) worker decline in small sized payrolls. Large payrolls fell by 100,000 (-5.3% y/y). In the goods producing sector there were 267,000 fewer jobs in April (-12.0% y/y). Medium-sized payrolls fell 114,000 (-12.5% y/y) followed by a 98,000 (-11.4% y/y) shortfall in small-sized payrolls. Large payrolls fell 55,000 (-12.1% y/y). In the manufacturing sector alone, payrolls fell 149,000 (-11.8% y/y) and that rate of decline has been gaining steam.
Declines in employment in the service producing industry have lagged just slightly the factory sector's workforce contraction. The 265,000 (-3.1% y/y) decline last month was the fourteenth consecutive monthly decline. Medium-sized service payrolls fell 109,000 (-3.4% y/y) and small-sized payrolls were off 111,000 (-2.7% y/y). Large service producing payrolls dropped by 45,000 (-3.3% y/y).
The ADP National Employment Report data is maintained in Haver's
USECON database; historical figures date back to December 2000. The figures in this report cover only private sector jobs and exclude employment in the public sector, which rose an average 11,083 during the last twelve months.The full ADP National Employment Report can be found here
, and the ADP methodology is explained here.| LAXEPA@USECON | May | April | Y/Y | 2008 | 2007 | 2006 |
|---|---|---|---|---|---|---|
| Nonfarm Private Payroll Employment (m/m Chg.) | -532,000 | -545,000 | -4.8% | -0.4 | 1.2% | 2.0% |
by Tom Moeller June 3, 2009
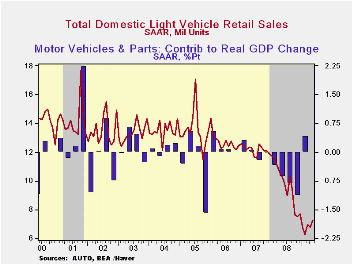
Consumers still are shying away from big-ticket expenditures. The added evidence of that trend is that unit sales of light vehicles during May increased just 6.4% m/m to make up an April decline. Year-to-date, total May vehicle sales remained down 3.8% at 9.91 million units (SAAR).
U.S. unit sales of light vehicles rebounded 7.0% to 7.26M units, still near the lowest since 1982 according to the Autodata Corporation and Ward's Automotive News. (Seasonal adjustment of the figures is provided by the U.S. Bureau of Economic Analysis). Sales of domestically made light trucks rose 9.1% to 4.01M units while auto sales rose a lesser 4.5% to 3.25M units. Sales of domestic vehicles YTD are down 5.6%.
Imported light vehicle sales also rose but
they made up only about one-third of their 14.0% m/m April decline. At
2.66M units they remained near their lowest level in roughly ten years.
Sales of imported light truck sales rose 9.4% to 0.91M units while
sales of imported autos rose a modest 2.7% returning only to their
February level. Sales of imported vehicles YTD increased 1.3%.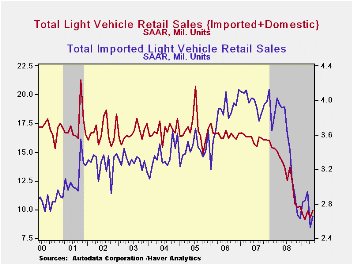
Overall, import's share of the U.S. light vehicle market fell again, last month to 26.8% which was their lowest level of this year. Nevertheless, the figure remained up from the 2008 average of 26.3%. (Imported vehicles are those produced outside the United States.) Imports' share of the U.S. car market totaled 34.9%, up slightly from the 2008 average, while the share of the light truck market was 18.6%, roughly equal to last year.
The U.S. vehicle sales figures can be found in Haver's USECON database.
The Financial Crisis - Toward an Explanation and Policy Response from the Federal Reserve Bank of Richmond is available here.
| Light Vehicle Sales (SAAR, Mil. Units) | May | April | March | May Y/Y | 2008 | 2007 | 2006 |
|---|---|---|---|---|---|---|---|
| Total | 9.91 | 9.32 | 9.86 | -30.5% | 13.17 | 16.16 | 16.54 |
| Autos | 4.99 | 4.81 | 5.09 | -36.4 | 6.71 | 7.58 | 7.77 |
| Domestic | 3.25 | 3.11 | 3.23 | -37.1 | 4.42 | 5.07 | 5.31 |
| Imported | 1.74 | 1.70 | 1.86 | -35.0 | 2.29 | 2.52 | 2.45 |
| Light Trucks | 4.92 | 4.51 | 4.78 | -23.3 | 6.47 | 8.60 | 8.78 |
| Domestic | 4.01 | 3.67 | 3.70 | -22.6 | 5.29 | 7.10 | 7.42 |
| Imported | 0.91 | 0.84 | 1.08 | -26.0 | 1.18 | 1.47 | 1.37 |
by Tom Moeller June 3, 2009
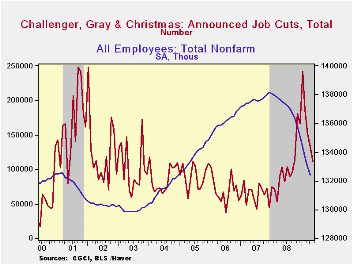
The outplacement firm of Challenger, Grey & Christmas indicated that job cut announcements eased for the fourth consecutive month. The announcement of 111,182 layoffs followed 132,590 during April. This cycle's largest layoff total occurred in January when there were 241,749 cuts. Challenger also reported, however, that announced hiring plans fell sharply after their jump during April.
Announcement of job cuts in the pharmaceutical industry fell even further after the sharp April decline to 698. Announcements in the retail industry also fell for the fourth consecutive month while job cuts in the real estate industry evaporated. Cuts in the retail industry fell as did cuts in the insurance and in the industrial goods sectors.
Picking up some steam were job cut announcements in the computer and in the construction sectors. The health care sector job cut announcements rose sharply.
During the last ten years there has been a 67% (inverse) correlation between the three month moving average of announced job cuts and the three month change payroll employment. Job cut announcements differ from layoffs. Many are achieved through attrition, early retirement or just never occur.
The Challenger figures are available in Haver's SURVEYS database.
| Challenger, Gray & Christmas | May | April | Y/Y | 2008 | 2007 | 2006 |
|---|---|---|---|---|---|---|
| Announced Job Cuts | 111,182 | 132,590 | 7.4% | 1,223,993 | 768,264 | 839,822 |
by Robert Brusca June 3, 2009
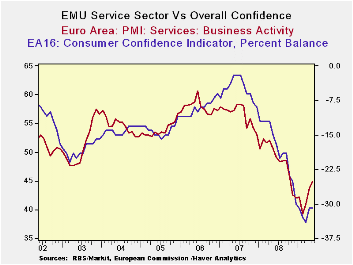
The real story this month is not that the services PMI in EMU
continued to improve, but that in the UK the PMI reading for the
services sector leapt over the neutral zone to score a positive reading
at 51.72.
The UK is now showing the strongest service sector in EU. At
48.33 and still showing decline, France is in second place. Spain‘s
service sector weakened this month, dropping from 42.30 to 39.14 and is
now below Ireland’s reading.
The services reading for EMU is in the bottom 26% of its
range. But that is stronger than the services reading from the EU
Commission index for services; that reading is in the bottom 3.7% of is
range. Consumer confidence for EMU is also low in the bottom 8% of its
range.
The news here is that the service sector, as is true for the
MFG sector, finds improvement is in train. That is good news and what
we have come to expect. Different surveys show different degrees of
change – that is not too surprising. Within the Zone we have countries
moving at different speeds- not surprising either–as well as in
different directions, and that is not good at all. The UK is the
strongest EU country in terms of its service sector, Spain with 18%
unemployment is seeing its service sector being dragged down. Were
Spain the UK its currency might drop to stimulate the economy, but
since Spain is In EMU and the UK is out, that possibility is not
Spain’s and the UK does not need such stimulus. Spain is a problem for
EMU and despite rhetoric to the contrary the Zone itself owns Spain
some assistance. In a currency union, even one with separate fiscal
responsibilities like fiscal Japanese lunch box there still are joint
responsibilities to the members.
| Markit Services Indices for EU/EMU | |||||||
|---|---|---|---|---|---|---|---|
| May-09 | Apr-09 | Mar-09 | 3Mo | 6Mo | 12Mo | Percentile | |
| Euro-Area | 44.82 | 43.76 | 40.95 | 43.18 | 42.17 | 44.63 | 26.1% |
| Germany | 45.17 | 43.76 | 42.30 | 43.74 | 44.05 | 47.05 | 19.6% |
| France | 48.33 | 46.52 | 43.64 | 46.16 | 43.63 | 45.94 | 36.5% |
| Italy | 43.08 | 42.05 | 39.10 | 41.41 | 40.58 | 43.38 | 21.8% |
| Spain | 39.14 | 42.30 | 34.11 | 38.52 | 35.20 | 35.04 | 33.9% |
| Ireland | 39.49 | 32.16 | 35.69 | 35.78 | 34.53 | 36.65 | 22.4% |
| EU only | |||||||
| UK (CIPs) | 51.72 | 48.68 | 45.47 | 48.62 | 45.30 | 45.33 | 56.9% |
| EU Commission Indices for EU and EMU | |||||||
| EU Index | May-09 | Apr-09 | Mar-09 | 3Mo | 6Mo | 12Mo | Percentile |
| EU Services | -26 | -30 | -31 | -32.00 | -31.67 | -26.17 | 8.3% |
| EMU | May-09 | Apr-09 | Mar-09 | 3Mo | 6Mo | 12Mo | Percentile |
| Services | -23 | -24 | -25 | -24.00 | -22.50 | -14.04 | 3.7% |
| Cons Confidence | -31 | -31 | -34 | -32.00 | -31.67 | -18.08 | 8.3% |
| Consumer Confidence By Country | |||||||
| Germany-Ccon | -35 | -34 | -31 | -33.33 | -29.67 | -19.50 | 0.0% |
| France-Ccon | -33 | -32 | -36 | -33.67 | -34.33 | -30.00 | 7.5% |
| Ital-Ccon | -26 | -25 | -31 | -27.33 | -27.67 | -25.75 | 15.2% |
| UK-Ccon | -22 | -22 | -28 | -24.00 | -28.00 | -26.25 | 34.2% |
| Percentile is over range since May 2000 | |||||||

Tom Moeller
AuthorMore in Author Profile »Prior to joining Haver Analytics in 2000, Mr. Moeller worked as the Economist at Chancellor Capital Management from 1985 to 1999. There, he developed comprehensive economic forecasts and interpreted economic data for equity and fixed income portfolio managers. Also at Chancellor, Mr. Moeller worked as an equity analyst and was responsible for researching and rating companies in the economically sensitive automobile and housing industries for investment in Chancellor’s equity portfolio. Prior to joining Chancellor, Mr. Moeller was an Economist at Citibank from 1979 to 1984. He also analyzed pricing behavior in the metals industry for the Council on Wage and Price Stability in Washington, D.C. In 1999, Mr. Moeller received the award for most accurate forecast from the Forecasters' Club of New York. From 1990 to 1992 he was President of the New York Association for Business Economists. Mr. Moeller earned an M.B.A. in Finance from Fordham University, where he graduated in 1987. He holds a Bachelor of Arts in Economics from George Washington University.
More Economy in Brief


