 Global| Nov 05 2008
U.S. ISM Nonmanufacturing Index Fell Sharply: Recession Indicated
by:Tom Moeller
|in:Economy in Brief
Summary
The Composite Index for the nonmanufacturing sector from the Institute for Supply Management fell sharply in October. It declined to 44.4 from an unrevised 50.2 during September. The figure, which was weaker than Consensus [...]
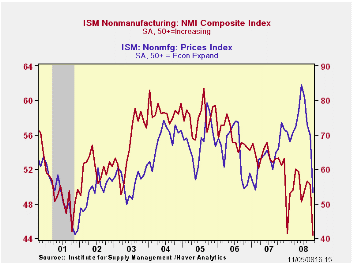
The Composite Index for the nonmanufacturing sector from the Institute for Supply Management fell sharply in October. It declined to 44.4 from an unrevised 50.2 during September. The figure, which was weaker than Consensus expectations, was the lowest in the series' relatively brief ten year history.It rivaled the low during the 2001 recession.
The nonmanufacturing business activity sub-index also fell sharply to 44.2 which was the lowest level since this past January. Each figure was the lowest since the last recession. Since the series' inception in 1997 there has been a 48% correlation between the level of the business activity index for the nonmanufacturing sector and the Q/Q change in real GDP for the services and the construction sectors.
The employment index fell to 41.5, a new low for the series.
Since the series' inception in 1997 there has been a 56% correlation
between the level of the ISM nonmanufacturing employment index and the
m/m change in payroll employment in the service-producing plus the
construction industries.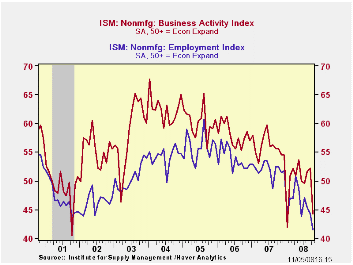
The new orders sub-index fell sharply to a recession level of 44.0.
Pricing power also collapsed. The reading of 53.4 was its lowest level since 2003. Since inception ten years ago, there has been a 60% correlation between the price index and the q/q change in the GDP services chain price index.
Beginning with the January 2008 Nonmanufacturing Report On Business®, the composite index is calculated as an indicator of the overall economic condition for the non-manufacturing sector. It is a composite index based on the diffusion indexes for four of the indicators (business activity, new orders, employment and supplier deliveries) with equal weights. The latest report from the ISM can be found here.
ISM surveys more than 370 purchasing managers in more than 62 industries including law firms, hospitals, government and retailers. The nonmanufacturing survey dates back to July 1997.
Interpreting the Great Moderation: changes in the volatility of economic activity at the macro and micro levels from the Federal Reserve Bank of New York can be found here.
| ISM Nonmanufacturing Survey | October | September | October '07 | 2007 | 2006 | 2005 |
|---|---|---|---|---|---|---|
| Composite Index | 44.4 | 50.2 | 53.3 | 53.5 | 55.7 | 58.0 |
| Prices Index | 53.4 | 70.0 | 66.1 | 63.8 | 65.3 | 68.0 |
by Tom Moeller November 5, 2008
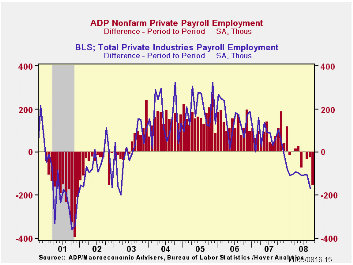 The payroll processor ADP indicated in its latest National
Employment Report that October private nonfarm payrolls fell 157,000
after a revised 25,000 September decline. The latest was the third
decline in as many months and it was the largest since November 2002.
During the last three months payrolls have fallen 0.2%.
The payroll processor ADP indicated in its latest National
Employment Report that October private nonfarm payrolls fell 157,000
after a revised 25,000 September decline. The latest was the third
decline in as many months and it was the largest since November 2002.
During the last three months payrolls have fallen 0.2%.
The U.S. Bureau of Labor Statistics will report on October payroll employment this Friday. Last month, the 25,000 worker decline in ADP's measure of private nonfarm payrolls was accompanied by a 168,000 (-0.7% y/y) worker decline in the BLS measure of private sector payrolls.
According to ADP and Macro Advisers, the correlation between the monthly percentage change in the ADP estimate and that in the BLS data is 0.90.
By the ADP measure, goods producing payrolls fell by 126,000
(-3.3% y/y). The largest decline was amongst medium sized payrolls
which fell 65,000 (-3.6% y/y) followed by a 36,000 (-2.0% y/y) drop in
small sized payrolls. Large payrolls fell 25,000 (-5.0% y/y).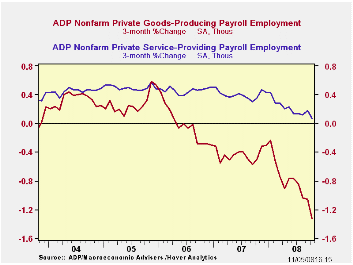
Employment in the manufacturing sector fell 85,000 (-3.4% y/y) It has fallen in each month since late-2005.
Employment in the service producing industry added to the weakness in the goods producing sector and payrolls fell 31,000 (+0.9% y/y). It was their first decline since 2002. Medium sized payrolls fell 26,000 (+0.7% y/y) and large service producing payrolls dropped by 16,000 (-0.3% y/y). Small service producing payrolls rose by 11,000 (1.4% y/y).
ADP compiled the estimate from its database of individual companies' payroll information. Macroeconomic Advisers, LLC, the St. Louis economic consulting firm, developed the methodology for transforming the raw data into an economic indicator.
The ADP National Employment Report data is maintained in Haver's
USECON database; historical data go back to December 2000. The figures in this report cover only private sector jobs and exclude employment in the public sector, which rose an average 11,083 during the last twelve months
The full ADP National Employment Report can be found here, and the ADP methodology is explained here.
| LAXEPA@USECON | October | September | Y/Y | 2007 | 2006 | 2005 |
|---|---|---|---|---|---|---|
| Nonfarm Private Payroll Employment (m/m Chg.) | -157,000 | -26,000 | 0.1% | 1.1% | 1.7% | 1.8% |
by Tom Moeller November 5, 2008
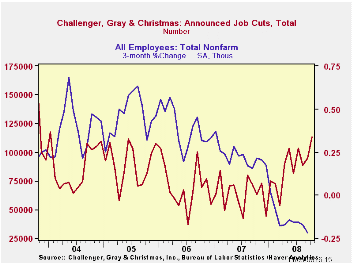
According to the Challenger, Grey & Christmas survey, layoffs jumped last to their highest level since January of 2004. The rise to 112,884 was a near-doubling from last October and the three-month level layoffs at 98,905 was its highest since early 2006.
The rise in layoffs last month was led by 17,949 cuts in financial industries and 15,692 cuts in the automotive industry. There also were 6,946 layoffs in the consumer goods sector, 6,301 in the electronics industries and 5,930 layoffs in the telecommunication businesses
During the last ten years there has been a 76% (inverse) correlation between the three-month moving average of announced job cuts and the three-month change payroll employment.
Job cut announcements differ from layoffs. Many are achieved through attrition, early retirement or just never occur.
Challenger also reported that announced hiring plans fell 3.2% y/y.
The causes and consequences of economic restructuring: evidence from the early 21st century from the Federal Reserve Board can be found here.
| Challenger, Gray & Christmas | October | September | Y/Y | 2007 | 2006 | 2005 |
|---|---|---|---|---|---|---|
| Announced Job Cuts | 112,884 | 95,094 | 78.9% | 768,264 | 839,822 | 1,072,054 |
by Robert Brusca November 5, 2008
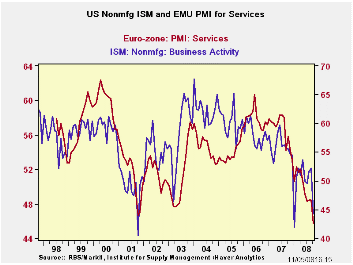
The chart serves as yet another reminder as to why it has been
loopy for observers to have insisted that Europe and the US had become
disconnected economically – the so-called de-coupling argument. The MFG
sectors across countries are always closely connected because they
trade goods and compete in the same markets for the same business. The
services sectors have a lower incidence of tradable services – much
lower than for goods. Still, the overall EMU and US economies have been
on such similar cycles that their two service sector indices, with very
few exceptions, have been on the same page.
The EMU in country level measures are mostly on their
respective lowest readings since May of 2000. The US measure is in its
bottom 13% of its range –also very weak. Germany’s measure is ‘only’ in
the bottom 28% of its range.
The drop in the EMU index in October is its largest m/m drop
since May 2000 when the comparisons start.
We can also see that consumer confidence is very low in most
of these same places. Since the service sector provides the bulk of the
jobs, this is an expected result.
However we can also use this report as a double check on the
MFG report which earlier was reported to have fallen so sharply. These
two sectors are showing the same sharp onset of weakness. That tends to
imbue the signal with a greater veracity than if the result came from
just one survey. The weak signal therefore seems to be the result of a
real weakness in the economy rather than from some quirk of the
calendar or a peculiarity of one survey.
| NTC Services Indices for EU/EMU | |||||||
|---|---|---|---|---|---|---|---|
| OCT-08 | SEP-08 | AUG-08 | 3Mo | 6Mo | 12Mo | Percentile | |
| Euro-13 | 45.76 | 48.44 | 48.46 | 47.55 | 48.45 | 50.37 | 0.0% |
| Germany | 48.31 | 50.25 | 51.39 | 49.98 | 51.49 | 51.78 | 28.3% |
| France | 47.54 | 50.14 | 48.04 | 48.57 | 48.96 | 53.05 | 0.4% |
| Italy | 45.68 | 49.42 | 48.47 | 47.86 | 47.63 | 48.32 | 0.6% |
| Spain | 32.22 | 36.09 | 38.98 | 35.76 | 37.39 | 41.65 | 0.0% |
| Ireland | 36.05 | 40.80 | 39.82 | 38.89 | 40.65 | 45.31 | 0.0% |
| EU only | |||||||
| UK (CIPs) | 42.39 | 45.95 | 49.17 | 45.84 | 46.98 | 49.60 | 0.0% |
| US NONFMG ISM | 44.20 | 52.10 | 51.60 | 49.30 | 50.17 | 50.48 | 13.6% |
| EU Commission Indices for EU and EMU | |||||||
| EU Index | OCT-08 | SEP-08 | AUG-08 | 3Mo | 6Mo | 12Mo | Percentile |
| EU Services | -10 | -4 | -2 | -20.67 | -19.00 | -14.92 | 0.0% |
| EMU | OCT-08 | SEP-08 | AUG-08 | 3Mo | 6Mo | 12Mo | Percentile |
| Services | -6 | 0 | 1 | -1.67 | 2.17 | 5.79 | 0.0% |
| Cons Confidence | -24 | -19 | -19 | -20.67 | -19.00 | -1.11 | 0.0% |
| Consumer confidence by country | |||||||
| Germany-Consumer Confidence | -12 | -9 | -9 | -10.00 | -7.50 | -3.83 | 34.4% |
| France-Consumer Confidence | -32 | -24 | -23 | -26.33 | -23.83 | -18.58 | 0.0% |
| Ital-Consumer Confidence | -23 | -22 | -24 | -23.00 | -22.83 | -22.83 | 13.8% |
| Spain-Consumer Confidence | -44 | -39 | -37 | -40.00 | -38.00 | -29.08 | 0.0% |
| UK-Consumer Confidence | -27 | -23 | -24 | -24.67 | -22.50 | -15.25 | 0.0% |
| percentile is over range since May 2000 | |||||||

Tom Moeller
AuthorMore in Author Profile »Prior to joining Haver Analytics in 2000, Mr. Moeller worked as the Economist at Chancellor Capital Management from 1985 to 1999. There, he developed comprehensive economic forecasts and interpreted economic data for equity and fixed income portfolio managers. Also at Chancellor, Mr. Moeller worked as an equity analyst and was responsible for researching and rating companies in the economically sensitive automobile and housing industries for investment in Chancellor’s equity portfolio. Prior to joining Chancellor, Mr. Moeller was an Economist at Citibank from 1979 to 1984. He also analyzed pricing behavior in the metals industry for the Council on Wage and Price Stability in Washington, D.C. In 1999, Mr. Moeller received the award for most accurate forecast from the Forecasters' Club of New York. From 1990 to 1992 he was President of the New York Association for Business Economists. Mr. Moeller earned an M.B.A. in Finance from Fordham University, where he graduated in 1987. He holds a Bachelor of Arts in Economics from George Washington University.
More Economy in Brief


