 Global| Feb 05 2008
U.S. ISM Non-Manufacturing Index Down Sharply, Lowest Since 2001
by:Tom Moeller
|in:Economy in Brief
Summary
The January Business Activity Index for the non-manufacturing sector, from the Institute for Supply Management, fell out of bed to 41.9 from 54.4 in December. A figure above 50 indicates rising activity and the latest was quite a bit [...]
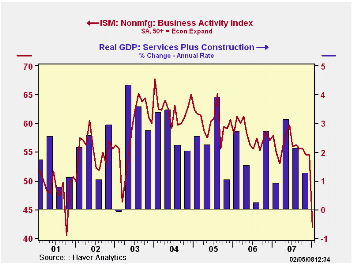
The January Business Activity Index for the non-manufacturing sector, from the Institute for Supply Management, fell out of bed to 41.9 from 54.4 in December. A figure above 50 indicates rising activity and the latest was quite a bit lower than Consensus expectations for a reading of 52.5.
Since the series' inception in 1997 there has been a 44% correlation between the level of the Business Activity Index in the non-manufacturing sector and the Q/Q change in real GDP for the services and the construction sectors. The correlation of the factory sector ISM index with the change in real GDP less just services is a higher 57%, though over the last ten years it only has been 34%.
The January level was the lowest since October 2001 and it was the first below 50 since 2003. October 2001 was about the end of that year's economic recession. The 12.5 point drop in the index from December was a record m/m decline.
The new orders sub index dropped ten points m/m to a reading of 43.5, the lowest since 2001. 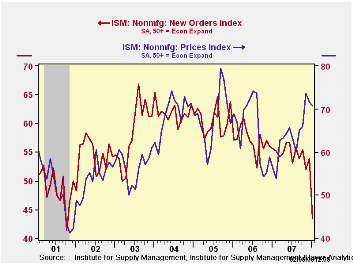
The employment sub index similarly fell sharply to its lowest level since 2002. Since the series' inception in 1997 there has been a 56% correlation between the level of the ISM non-manufacturing employment index and the m/m change in payroll employment in the service producing plus the construction industries.
Pricing power eased slightly m/m for the second month. Since inception ten years ago, there has been a 60% correlation between the price index and the q/q change in the GDP services chain price index.
ISM surveys more than 370 purchasing managers in more than 62 industries including construction, law firms, hospitals, government and retailers. The non-manufacturing survey dates back to July 1997.The Business Activity Index for the non-manufacturing sector reflects a question separate from the subgroups mentioned above. In contrast, the ISM manufacturing sector composite index is a weighted average of five components.
Released yesterday, The Budget Message of the President can be found here and The Nation's Fiscal Outlook is available here.
| ISM Nonmanufacturing Survey | January | December | January '07 | 2007 | 2006 | 2005 |
|---|---|---|---|---|---|---|
| Business Activity Index | 41.9 | 54.4 | 57.9 | 56.0 | 58.0 | 60.2 |
| Prices Index | 70.7 | 71.5 | 56.1 | 63.8 | 65.3 | 68.0 |
by Tom Moeller February 5, 2008
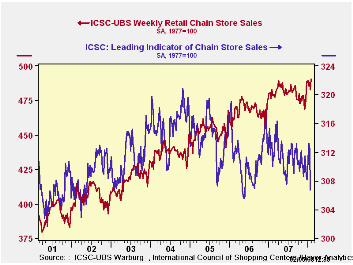
The ICSC-UBS retail chain-store sales index is constructed using the same-store sales (stores open for one year) reported by 78 stores of seven retailers: Dayton Hudson, Federated, Kmart, May, J.C. Penney, Sears and Wal-Mart.
During the last week of January the leading indicator of chain store sales from ICSC-UBS collapsed by 1.8% w/w after a 0.3% decline during the prior week. For all of January the leading indicator fell 0.1%, the third consecutive slight m/m decline.
Monday's speech, Protecting Homeowners and Sustaining Home Ownership, by Federal Reserve Board Governor Kroszner is available here .
| ICSC-UBS (SA, 1977=100) | 02/02/08 | 01/26/08 | Y/Y | 2007 | 2006 | 2005 |
|---|---|---|---|---|---|---|
| Total Weekly Chain Store Sales | 490.6 | 482.6 | 1.6 % | 2.8% | 3.3% | 3.6% |
by Tom Moeller February 5, 2008
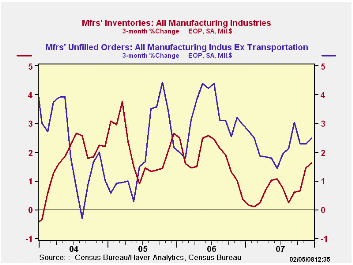
Factory inventories rose 0.8% during December. That gain followed a 0.7% increase during November and pulled the three month increase in inventories to 1.6%, up from a low of 0.2% in August. Nevertheless the 3.6% rise in inventories last year was well below the 6.4% increase during 2006.
Excluding the volatile transportation sector, inventories rose 0.4% in December and the three month average rate of accumulation of 0.4% is up from 0.1% decumulation in August. The civilian aircraft industry very much dominated the factory sector figures last year with a 7.1% gain in inventories over the year's final three months and a 23.2% gain y/y.
A 2.3% rise in total factory orders during December also was dominated by an 11.7% (28.4% y/y) surge in orders for civilian aircraft. It followed a 28.6% November jump. Overall, a 5.0% rise in orders for durable goods was reduced only slightly from the advance report of a 5.2% increase.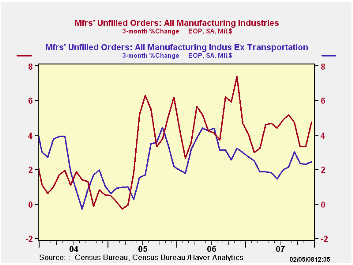
The aircraft industry just couldn't keep shipments up with the inflow of new orders. Unfilled orders of civilian aircraft & parts surged 4.2% in December (42.7% y/y) and the average change during the final three months of 2007 was 10.1%. Excluding the transportation sector altogether unfilled orders rose 1.3% in December and the three month average growth rate was a still firm 2.5%. That rate of increase has been fairly steady of late.
Factory shipments fell 0.3% in December after gains of 1.3% and 1.2% during the prior two months. Excluding transportation shipments fell 0.1% after gains of 1.6% and 1.4%.
Publishing FOMC Economic Forecasts from the Federal Reserve Bank of San Francisco can be found here.
| Factory Survey (NAICS, %) | December | November | Y/Y | 2007 | 2006 | 2005 |
|---|---|---|---|---|---|---|
| Inventories | 0.8 | 0.7 | 3.6 | 3.6 | 6.4 | 8.9 |
| New Orders | 2.3 | 1.7 | 6.1 | 1.4 | 5.1 | 11.6 |
| Excluding Transportation | 0.7 | 1.5 | 5.9 | 1.2 | 5.4 | 11.5 |
| Shipments | -0.3 | 1.3 | 4.1 | 1.1 | 4.3 | 10.3 |
| Unfilled Orders | 2.5 | 1.2 | 18.2 | 18.2 | 20.0 | 15.0 |
| Excluding Transportation | 1.3 | 0.5 | 9.1 | 9.1 | 14.1 | 8.4 |
by Robert Brusca February 5, 2008
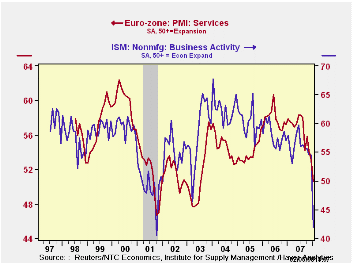
So much for de-coupling…
The US and Europe, arguably, have never been more in sync (or maybe I should say ‘sink’) than they are right now. Europe’s MFG PMI is holding up as is the MFG index in the US. Oddly, in both countries, it is the non-MFG index that is falling sharply. In the US Manufacturing tends to be the most directional of these two sorts of surveys, while in Europe they have tended to move more in concert. Still, the rise in the manufacturing PMI in Europe for January as the service index sinks lower is unconventional.
Across the Euro Area there is plenty of evidence of service sector weakness with Spain‘s index on an all-time low and Italy’s near the bottom of its all-time range. Germany’s Service sector is below the midpoint of its normal range. France’s absolute reading is strong but it is also eroding with a new sense of urgency.
There is something unique about this cycle if a down leg is being featured. It is that it is being led by services… AND that services weakness seems to be leading weakness even in the job market where that sector makes a much more than a proportionate contribution.
As a cyclical signal, these PMI readings are the worst in the US and in Europe while other gauges like consumer spending and consumer confidence are lower, they are only lower and not ‘signaling’ anything. It is unusual for the PMIs to lead the parade of weakness lower. In Europe the fall is sharp in January. In the US drop off is more dramatic and clearly recessionary in nature. These are clearly variables whose trends we will want to watch; we will also want to watch to see if Manufacturing PMI’s eventually succumb to this weakness or not.
| Jan-08 | Dec-07 | Nov-07 | 3Mo | 6Mo | 12Mo | Percentile | |
| Euro-13 | 50.56 | 53.14 | 54.14 | 52.61 | 54.32 | 55.97 | 27.3% |
| Germany | 49.17 | 51.24 | 53.09 | 51.17 | 53.57 | 55.74 | 33.2% |
| France | 56.60 | 58.89 | 59.15 | 58.21 | 58.05 | 58.41 | 46.8% |
| Italy | 47.86 | 49.71 | 50.77 | 49.45 | 52.28 | 54.23 | 3.8% |
| Spain | 44.24 | 50.99 | 50.69 | 48.64 | 50.71 | 53.31 | 0.0% |
| Ireland | 51.90 | 53.53 | 52.81 | 52.75 | 54.41 | 56.39 | 29.9% |
| EU only | |||||||
| UK | 52.46 | 52.36 | 51.95 | 52.26 | 54.02 | 55.69 | 43.2% |
| percentile is over range since May 2000 | |||||||
by Robert Brusca February 5, 2008
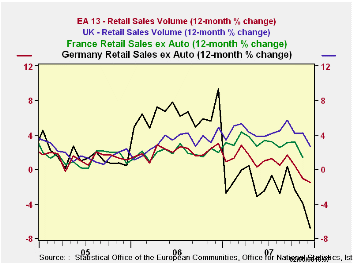
EMU retail sales are doing badly. German sales look worse than they are in the yr/yr graph due to the comparison with the December base in 2006 just ahead of the introduction of the VAT hike in 2007. That pushed activity into Dec of 2006 and robbed it from early 2007. Still on shorter horizons Euro retail sales are not doing well as the growth rate in the table reminds us. Moreover German sales are doing really poorly even without suing a year/year comparison.
For the quarter-to-date EMU retail sales volumes are dropping at a 4.3% annual rate. Food is off at a 3.1% pace, and no food purchases are falling at a 4.5% pace. Germany leads this quarter –to-quarter weakness with a sales volume drop for nonfoods of 10.5%. That compares to a rise at a 2.6% pace in France and a rise in the UK (an EU, not EMU, country) of 3.1%.
What is worst is that the progressive growth rates (12-Mo to 6-Mo to 3-Mo) show that a slowing is underway in the Euro Area as well as in Germany, in Italy, in the UK and partly for France.
While the raw results for December and the fourth quarter are disquieting, the ongoing trend decline in retail sales volumes is even more disturbing. We cannot yet tell if the manufacturing sector will remain strong enough to hold growth aloft or if this weakness in the consumer sector is enough to drag the EMU economics lower.
It is hard to tell how much special factors like the strong euro or the weak finical sector or whatever drove the January services PMI lower might be responsible. What is clear is that there is more weakness in train than we had previously thought and it is showing up in various places at slightly different times.
| Dec-07 | Nov-07 | Oct-07 | 3-Mo | 6-MO | 12-Mo | |
| Euro Area (13) Total | -0.1% | -0.7% | -0.6% | -5.4% | -1.8% | -1.5% |
| Food | 0.0% | -1.0% | -0.4% | -5.3% | -1.6% | -1.6% |
| Non food | -0.1% | -0.4% | -0.8% | -5.3% | -2.0% | -1.4% |
| Textiles | #N/A | -0.5% | -3.1% | -6.3% | 3.9% | -0.2% |
| Household goods | #N/A | -0.7% | -0.5% | -9.9% | -1.2% | -2.4% |
| Books news, etc | #N/A | -0.1% | 0.2% | -1.6% | 2.8% | 0.9% |
| Pharmaceuticals | #N/A | 0.2% | 0.3% | 4.2% | 3.7% | 3.7% |
| Other Nonspecial goods | #N/A | -0.6% | 0.1% | 0.0% | 1.0% | -1.1% |
| Mail Order | #N/A | -1.1% | -1.1% | -8.2% | -4.1% | -2.3% |
| Non-food Country detail: Volume | ||||||
| Germany | 0.7% | -1.0% | -2.4% | -10.2% | -4.7% | -6.3% |
| France | 0.7% | -0.2% | 0.4% | 2.6% | 4.0% | 3.8% |
| Italy (Total, Value) | #N/A | -1.0% | 0.6% | -4.0% | -2.5% | -2.9% |
| UK(EU) | -0.1% | 0.4% | 0.1% | 1.5% | 3.4% | 4.0% |
| Shaded areas calculated on a one-month lag due to lagging data | ||||||
| The EA 13 countries are Austria, Belgium, Finland, France, Germany, Greece, Ireland, Italy, Luxembourg, the Netherlands, Portugal, Slovenia | ||||||
by Louise Curley February 5, 2008
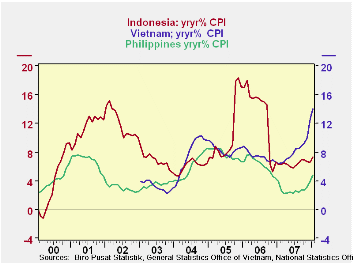
Six of the countries in the emerging markets data base EMERGEPR, which covers the Pacific Rim, have reported January data for the Consumer Price Index. The inflation picture that arises from these data (Defining inflation as the year to year change in the Consumer Price Index) covers a wide span from 2.96% in Taiwan to 14.0% in Vietnam. The first chart shows the headline inflation for Indonesia, Vietnam and the Philippines, the three relatively high inflation countries. The second chart shows the headline inflation for Taiwan, South Korea and Thailand, three relatively low inflation countries. All six countries show a rising trend for inflation over the past six months.
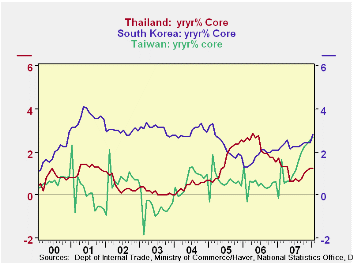
Core inflation rates, excluding food and energy, are available for Thailand since January '91, for South Korea, since January '76 and for Taiwan since January '92 and are shown in the third chart. Core rates of inflation in Korea and Thailand are rising more slowly than the headline series, but in Taiwan, the core rate has spiked in recent months.
Core inflation rates for the Philippines are available only from June, 2004 and for Indonesia, from December 2005. There are no core rates for Vietnam. The rationale for excluding food and energy prices from the Consumer Price index was based on the historical evidence that in industrialized countries these items tended to rise and fall around a fairly trend less norm. It was never clear that the concept should be applied to emerging countries. Recent history, however, suggests that the long term trend in food and energy prices, even in highly developed countries is no longer trend less but definitely rising, casting doubts about the usefulness of the core inflation concept.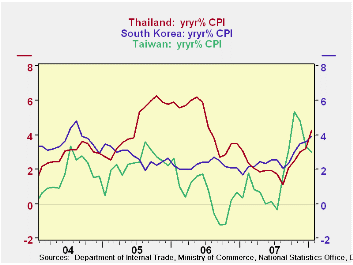
| INFLATION IN THE PACIFIC RIM | Jan 08 | Dec 07 | Nov 07 | Oct 07 | Sep 07 | Aug 07 |
|---|---|---|---|---|---|---|
| Year to Year Change in CPI | ||||||
| Indonesia | 7.36 | 6.59 | 6.71 | 6.88 | 6.95 | 6.51 |
| Vietnam | 14.09 | 12.57 | 10.04 | 9.35 | 8.80 | 8.55 |
| Philippines | 4.86 | 3.94 | 3.23 | 2.73 | 2.61 | 2.37 |
| Thailand | 4.26 | 3.21 | 3.03 | 2.51 | 2.09 | 1.13 |
| South Korea | 3.89 | 3.61 | 3.52 | 3.02 | 2.32 | 2.04 |
| Taiwan | 2.96 | 3.33 | 4.80 | 5.33 | 3.11 | 1.61 |
| Year to Year Change in CORE | ||||||
| Thailand | 1.23 | 1.24 | 1.14 | 1.05 | 0.76 | 0.67 |
| South Korea | 2.82 | 2.44 | 2.44 | 2.45 | 2.35 | 2.25 |
| Taiwan | 2.71 | 2.57 | 2.36 | 2.27 | 1.98 | 1.62 |
Tom Moeller
AuthorMore in Author Profile »Prior to joining Haver Analytics in 2000, Mr. Moeller worked as the Economist at Chancellor Capital Management from 1985 to 1999. There, he developed comprehensive economic forecasts and interpreted economic data for equity and fixed income portfolio managers. Also at Chancellor, Mr. Moeller worked as an equity analyst and was responsible for researching and rating companies in the economically sensitive automobile and housing industries for investment in Chancellor’s equity portfolio. Prior to joining Chancellor, Mr. Moeller was an Economist at Citibank from 1979 to 1984. He also analyzed pricing behavior in the metals industry for the Council on Wage and Price Stability in Washington, D.C. In 1999, Mr. Moeller received the award for most accurate forecast from the Forecasters' Club of New York. From 1990 to 1992 he was President of the New York Association for Business Economists. Mr. Moeller earned an M.B.A. in Finance from Fordham University, where he graduated in 1987. He holds a Bachelor of Arts in Economics from George Washington University.
More Economy in Brief
 Global| Feb 05 2026
Charts of the Week: Balanced Policy, Resilient Data and AI Narratives
by:Andrew Cates


