 Global| Apr 16 2007
U.S. Inventory Growth Stays Low as Sales Pick Up -- But Not Everywhere
Summary
For business overall, the Inventory/Sales ratio (I/S ratio) has roughly stabilized above its recent low and slightly off peak. This has been achieved by reductions in the pace of sales and in the pace of inventory accumulation. The [...]
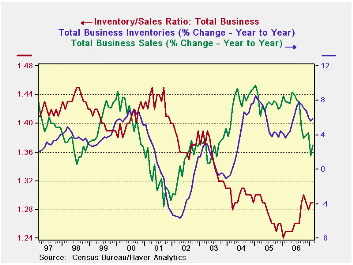
For business overall, the Inventory/Sales ratio (I/S ratio) has roughly stabilized above its recent low and slightly off peak. This has been achieved by reductions in the pace of sales and in the pace of inventory accumulation. The recent fall off has been about the same for inventories and sales but has not been the same for all sectors, and that’s where we find some lingering problems. There is some complication in discussing the I/S ratio since the ratio has been in a long secular decline. But with the low hit in January 2006 that trend seems to have been set aside. As a result we need to pick a recent horizon to assess I/S ratios. I choose a time frame of three years for that purpose.
Table 1 below shows the inventory/sales ratios across the major business groups, manufacturing, retailing and wholesaling. We also look at max and min statistics over the past three years in this table. To the right in that table you will find a column labeled “%-Tile”. That column puts each sector’s I/S ratio in the percentile of the range it has occupied over the past three years. There we find retailer inventories are low by this standard, as they reside in the bottom 20th percentile of their range. Wholesalers are perhaps about right with the ratio in the middle of its range. Manufacturing is in trouble for even as sales have softened and inventory growth has been reduced, the ratio of inventories to sales is still the highest it has been over the past three years in that sector. That is to say that manufactures have not yet adjusted output to the weaker pace of sales. And of course, we have no indications that the pace of sales is picking up either.
Table 2 below shows the paired growth rates across sectors and through time. These trends underlie the shifts in I/S ratios. You can view the S to I growth rate relationship in each period directly or peruse the time series of growth rates for say sales as its changes from a year ago to the current yr/yr pace to six months to three months.
Two out of three is not bad, but not good enough…
Of the three business sectors, two seem to be turning the corner and the other seems mired in a business quicksand of sorts. For overall business, sales rates have declined but they have not declined monotonically across the time groupings in the table, having rebounded in the recent three months.
Manufacturing: For manufactures the current three-month sales growth rate is still negative and the associated inventory growth rate is still positive, thus I/S problems are clearly still being exacerbated there. That’s bad news.
Retail: In retailing the recent 3-month sales bounce is strong in that there is barely any degradation when compared to the Yr/Yr pace. And the Yr/Yr pace for inventories is only slightly stronger for 3-month than over the past year. Moreover since sales are growing faster – much faster - than inventories, that sector seems OK.
Wholesaling: For wholesaling, the recent three-month sales growth rate is up strongly as well but it is noticeably weaker than its Yr/Yr rate of growth. But this sector is also quite healthy since sales are growing at about twice the pace of inventories, showing us that inventory adjustment seems to have been made smoothly.
Indeed if growth gaps like those between I and S persist inventory building will be in order for both wholesalers and retailers. Manufacturing is another sad story.
For now the inventory report paints a promising picture in wholesaling and retailing but continues to paint a bleak one in manufacturing where PMI surveys and orders data also show that other troubles lurk.
| Table 1. Inventory-to-Sales Ratios In Perspective Over three Years | |||||||||
|---|---|---|---|---|---|---|---|---|---|
| 2007 February | Current | 3-Mo Ago | 6-Mo Ago | Year Ago | 2 Years Ago | 3 Years Ago | %-tile | Max | Min |
| Total Business | 1.29 | 1.29 | 1.26 | 1.25 | 1.30 | 1.31 | 71.4% | 1.31 | 1.24 |
| Manufacturers | 1.25 | 1.23 | 1.17 | 1.16 | 1.21 | 1.22 | 100.0% | 1.25 | 1.15 |
| Retailers | 1.48 | 1.50 | 1.50 | 1.48 | 1.55 | 1.55 | 20.0% | 1.6 | 1.45 |
| Wholesalers | 1.15 | 1.16 | 1.13 | 1.14 | 1.17 | 1.17 | 50.0% | 1.18 | 1.12 |
| 2007 February | 3-Mo Growth | 6-Mo Growth | 12-Mo Growth | Year Ago Growth | ||||
| Sales | Inventory | Sales | Inventory | Sales | Inventory | Sales | Inventory | |
| Total Business | 3.3% | 2.3% | -2.3% | 2.6% | 2.9% | 5.9% | 7.9% | 3.7% |
| Manufacturers | -3.5% | 1.0% | -9.4% | 2.8% | -1.0% | 6.4% | 6.6% | 2.5% |
| Retailers | 7.0% | 2.9% | 2.5% | 0.0% | 3.4% | 3.5% | 7.2% | 2.5% |
| Wholesalers | 8.0% | 3.4% | 1.6% | 5.7% | 7.1% | 8.3% | 10.2% | 6.8% |

Robert Brusca
AuthorMore in Author Profile »Robert A. Brusca is Chief Economist of Fact and Opinion Economics, a consulting firm he founded in Manhattan. He has been an economist on Wall Street for over 25 years. He has visited central banking and large institutional clients in over 30 countries in his career as an economist. Mr. Brusca was a Divisional Research Chief at the Federal Reserve Bank of NY (Chief of the International Financial markets Division), a Fed Watcher at Irving Trust and Chief Economist at Nikko Securities International. He is widely quoted and appears in various media. Mr. Brusca holds an MA and Ph.D. in economics from Michigan State University and a BA in Economics from the University of Michigan. His research pursues his strong interests in non aligned policy economics as well as international economics. FAO Economics’ research targets investors to assist them in making better investment decisions in stocks, bonds and in a variety of international assets. The company does not manage money and has no conflicts in giving economic advice.
More Economy in Brief


