 Global| Jul 12 2006
U.S. Int'l Trade Deficit Deepened Less Than Expected
by:Tom Moeller
|in:Economy in Brief
Summary
The U.S. foreign trade deficit in May again deepened less than expected. The deficit of $63.8B compared to a little revised April gap of $63.3B and Consensus expectations for $64.9B. During the first five months of 2006 the foreign [...]
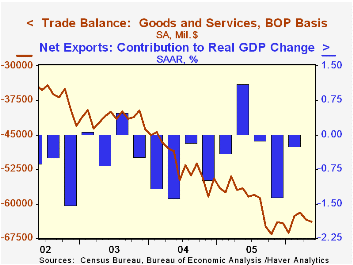
The U.S. foreign trade deficit in May again deepened less than expected. The deficit of $63.8B compared to a little revised April gap of $63.3B and Consensus expectations for $64.9B.
During the first five months of 2006 the foreign trade deficit averaged $63.6B versus a $56.4B deficit averaged during the first five months of 2005.
Total exports in May jumped 2.4% after a little revised April slip. A strong 5.2% pop in nonauto consumer goods exports (10.9% y/y) more than recovered the prior month's decline. Capital goods exports also were strong and posted a 2.4% (15.3% y/y) surge following three months of sideways movement. Exports of advanced technology products rose 0.9% (NSA, 16.6% y/y) while exports of industrial supplies & materials rose 3.4% (16.5% y/y).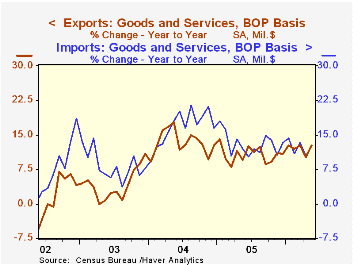
Imports rose 1.9% during May as petroleum imports surged 16.9% (49.8% y/y). Adjusted for a higher prices, including an 8.7% (43.4% y/y) spike in crude oil to $61.74 per bbl., constant dollar petroleum imports surged 8.2% (3.3% y/y). Crude oil prices fell in June but have since risen to record highs.
Imports of capital goods increased 0.5% (10.9% y/y) reflecting a 6.3% rise in imports of advanced technology products (NSA, 8.8% y/y) and a 0.1% (+3.9% y/y) slip in imports of nonauto consumer goods.
The US deficit in goods trade with China deepened to $17.7B ($201.6B for 2005) but the trade deficit with Japan improved to $7.1B ($82.7B in 2005). The trade deficit with the Asian NICs more than doubled to $1.7B ($15.9B in 2005) and the deficit with the European Union deepened to $10.8B ($122.4B in 2005).
The Mid-Session Review of the U.S. Government Budget for FY 2007 is available here.
| Foreign Trade | May | April | Y/Y | 2005 | 2004 | 2003 |
|---|---|---|---|---|---|---|
| Trade Deficit | $63.8B | $63.3B | $56.6B (5/05) | $716.7B | $611.3B | $494.9B |
| Exports - Goods & Services | 2.4% | -0.0% | 12.6% | 10.7% | 13.4% | 4.2% |
| Imports - Goods & Services | 1.8% | 0.8% | 12.7% | 13.0% | 16.7% | 8.3% |
by Tom Moeller July 12, 2006
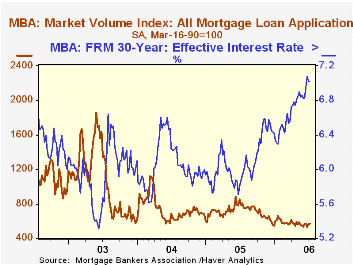
The total number of mortgage applications added 1.0% last week to the prior week's 5.9% gain. The rise lifted applications early in July 2.5% above the June average which fell 1.5% from May.
Purchase applications increased 2.6% and raised the early July level 4.8% above the June average which fell 0.8% from May.
During the last ten years there has been a 58% correlation between the y/y change in purchase applications and the change in new plus existing single family home sales.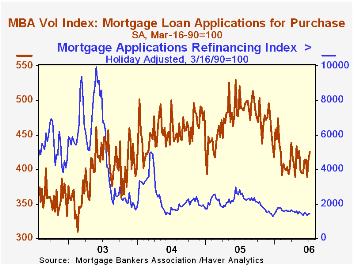
Applications to refinance fell 1.6% and the latest level was 1.4% below the June average. Refis during all of June fell 3.1% from the May average.
The effective interest rate on a conventional 30-year mortgage was stable w/w at 7.02% but the rate on 15-year financing ticked higher to 6.70%. Interest rates on 15 and 30 year mortgages are closely correlated (>90%) with the rate on 10 year Treasury securities.
During the last ten years there has been a (negative) 79% correlation between the level of applications for purchase and the effective interest rate on a 30-year mortgage.
The Mortgage Bankers Association surveys between 20 to 35 of the top lenders in the U.S. housing industry to derive its refinance, purchase and market indexes. The weekly survey accounts for more than 40% of all applications processed each week by mortgage lenders. Visit the Mortgage Bankers Association site here.
| MBA Mortgage Applications (3/16/90=100) | 07/07/06 | 06/30/06 | Y/Y | 2005 | 2004 | 2003 |
|---|---|---|---|---|---|---|
| Total Market Index | 566.8 | 561.0 | -28.4% | 708.6 | 735.1 | 1,067.9 |
| Purchase | 425.0 | 414.2 | -13.1% | 470.9 | 454.5 | 395.1 |
| Refinancing | 1,400.5 | 1,423.9 | -45.2% | 2,092.3 | 2,366.8 | 4,981.8 |
by Carol Stone July 12, 2006
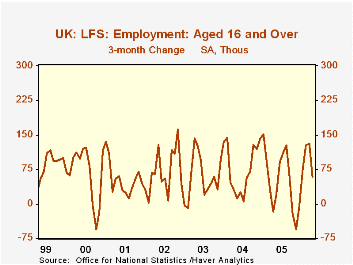
In the April accounting period for the UK labor force survey (3-month average, March through May) employment gave up some of its prior periods' gains. It had done nicely for the five month-to-month readings beginning in November, rising a total of 173,000 through March. But the April period saw employment fall by 38,000. This brought the 3-month change, the gauge used by UK's Office of National Statistics (ONS), down to 59,000 from 131,000 in March.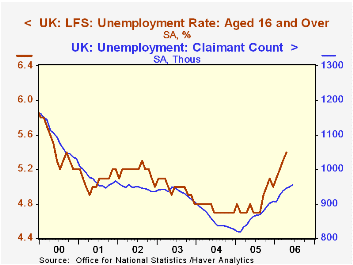
These moves leave the employment picture somewhat ambiguous. Unemployment, though, has a clearer picture. It is rising. The number unemployed is up 223,000, or 15.6%, from a year ago. The unemployment rate rose in April to 5.4%, its highest since the same level in September 2000. Similarly, claimants for unemployment benefits, which are published on a single-month basis and were issued today for June, increased 93,300 over a year ago to 956,600. This is the largest number since January 2002. However, the monthly increases have tapered a bit in the last couple of months, so perhaps the greatest erosion has past.
The number of job vacancies has stabilized. They totaled 603,000 in June, up from 583,900 in May. A 3-month moving average of these available jobs has hovered in a range of 593,000 to 603,000 since last October after falling sharply from a peak of 650,500 in December 2004.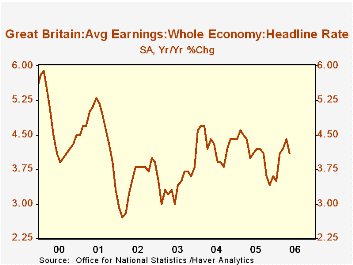
Finally, workers' earnings recovered from a period of softness in late 2005, reaching a 12-month growth rate of 4.4% in April, from a recent low of 3.5% in January. Then for May, they slowed a bit to 4.1%.
These conditions in the UK labor market have a cloudy cast. The unemployment data seem to be cause for discomfort, with a rising rate and rising unemployment insurance claims. But employment and wages performed well over the winter into the spring and the number of job vacancies is holding steady. Thus, while the jobs data don't look vigorous, they are holding up but unemployment is tending higher. A very mixed view.
| Jun 2006 | May 2006 | Apr 2006 | Mar 2006 | Year Ago | 2005 | 2004 | 2003 | |
|---|---|---|---|---|---|---|---|---|
| Employment (3Mo Avg, SA, Thous) |
-- | -- | 28,899 | 28,937 | 28,676 | 28,743 | 28,465 | 28,183 |
| Chg from 1 & 3 Months Ago | -- | -- | -38/59 | +41/131 | +19(MoAvg) | 1.0% | 1.0% | 1.0% |
| Unemployment Rate (3Mo Avg, SA, %) |
-- | -- | 5.4% | 5.3% | 4.7% | 4.8% | 4.8% | 5.0% |
| Claimant Count (Monthly, Thous) |
956.6 | 950.7 | 945.1 | 937.8 | 863.3 | 861.1 | 853.6 | 933.3 |
| Vacancies (Monthly, Thous) | 603.0 | 583.9 | 604.9 | 589.9 | 615.3 | 618.5 | 631.9 | 581.9 |
| Average Earnings Index inc Bonus (Headline Rate*) | -- | 4.1% | 4.4% | 4.2% | 4.0% | 4.1% | 4.3% | 3.4% |
Tom Moeller
AuthorMore in Author Profile »Prior to joining Haver Analytics in 2000, Mr. Moeller worked as the Economist at Chancellor Capital Management from 1985 to 1999. There, he developed comprehensive economic forecasts and interpreted economic data for equity and fixed income portfolio managers. Also at Chancellor, Mr. Moeller worked as an equity analyst and was responsible for researching and rating companies in the economically sensitive automobile and housing industries for investment in Chancellor’s equity portfolio. Prior to joining Chancellor, Mr. Moeller was an Economist at Citibank from 1979 to 1984. He also analyzed pricing behavior in the metals industry for the Council on Wage and Price Stability in Washington, D.C. In 1999, Mr. Moeller received the award for most accurate forecast from the Forecasters' Club of New York. From 1990 to 1992 he was President of the New York Association for Business Economists. Mr. Moeller earned an M.B.A. in Finance from Fordham University, where he graduated in 1987. He holds a Bachelor of Arts in Economics from George Washington University.
More Economy in Brief
 Global| Feb 05 2026
Charts of the Week: Balanced Policy, Resilient Data and AI Narratives
by:Andrew Cates


